Zip Codes with the Highest Percentage of Population Employed in Administrative & Support Services in Lawrence, MA
RELATED REPORTS & OPTIONS
Administrative & Support Services
Lawrence
Compare Zip Codes
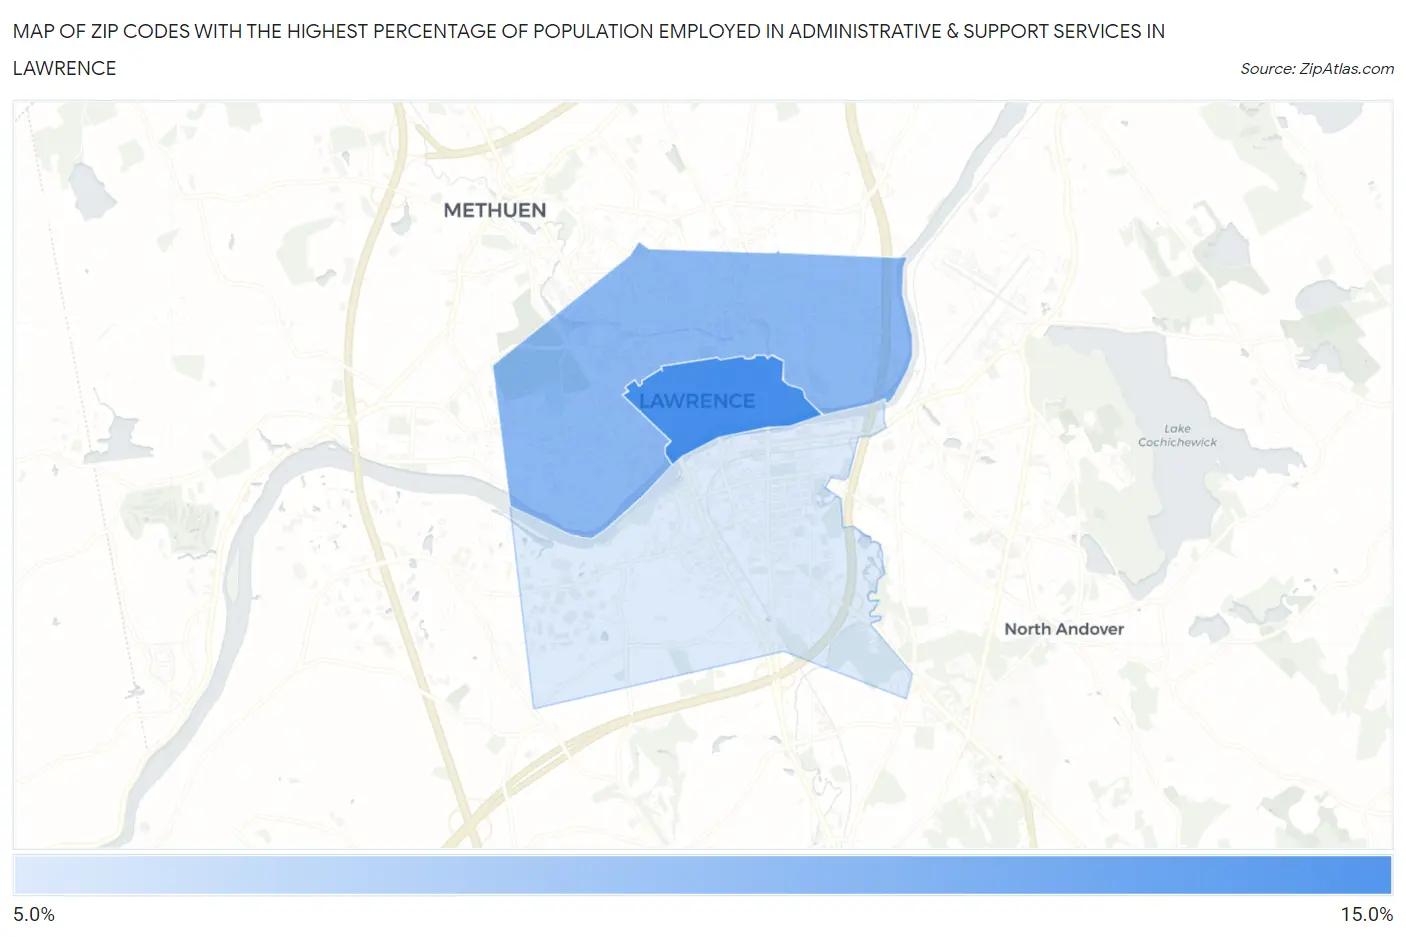
Map of Zip Codes with the Highest Percentage of Population Employed in Administrative & Support Services in Lawrence
0.0%
15.0%
Zip Codes with the Highest Percentage of Population Employed in Administrative & Support Services in Lawrence, MA
| Zip Code | % Employed | vs State | vs National | |
| 1. | 01840 | 14.8% | 3.6%(+11.1)#1 | 4.1%(+10.6)#553 |
| 2. | 01841 | 10.5% | 3.6%(+6.86)#9 | 4.1%(+6.35)#1,145 |
| 3. | 01843 | 5.5% | 3.6%(+1.89)#72 | 4.1%(+1.39)#5,743 |
1
Common Questions
What are the Top Zip Codes with the Highest Percentage of Population Employed in Administrative & Support Services in Lawrence, MA?
Top Zip Codes with the Highest Percentage of Population Employed in Administrative & Support Services in Lawrence, MA are:
What zip code has the Highest Percentage of Population Employed in Administrative & Support Services in Lawrence, MA?
01840 has the Highest Percentage of Population Employed in Administrative & Support Services in Lawrence, MA with 14.8%.
What is the Percentage of Population Employed in Administrative & Support Services in Lawrence, MA?
Percentage of Population Employed in Administrative & Support Services in Lawrence is 8.9%.
What is the Percentage of Population Employed in Administrative & Support Services in Massachusetts?
Percentage of Population Employed in Administrative & Support Services in Massachusetts is 3.6%.
What is the Percentage of Population Employed in Administrative & Support Services in the United States?
Percentage of Population Employed in Administrative & Support Services in the United States is 4.1%.