Zip Codes with the Highest Percentage of Population Employed in Security & Protection in Lawrence, MA
RELATED REPORTS & OPTIONS
Security & Protection
Lawrence
Compare Zip Codes
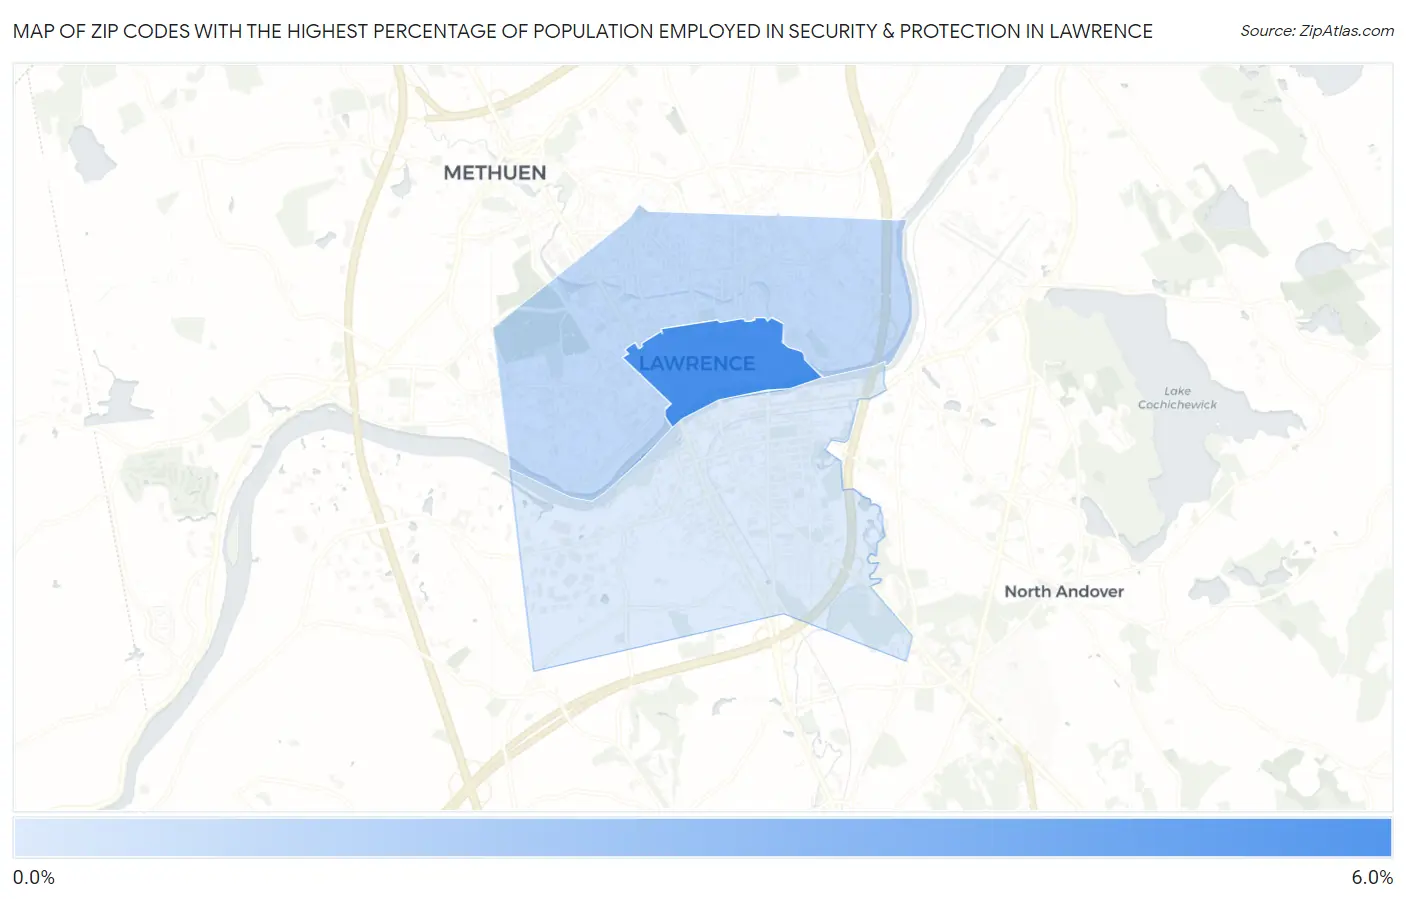
Map of Zip Codes with the Highest Percentage of Population Employed in Security & Protection in Lawrence
0.0%
6.0%
Zip Codes with the Highest Percentage of Population Employed in Security & Protection in Lawrence, MA
| Zip Code | % Employed | vs State | vs National | |
| 1. | 01840 | 5.3% | 2.0%(+3.31)#16 | 2.1%(+3.17)#2,612 |
| 2. | 01841 | 1.9% | 2.0%(-0.121)#228 | 2.1%(-0.255)#13,276 |
| 3. | 01843 | 1.1% | 2.0%(-0.960)#357 | 2.1%(-1.09)#19,628 |
1
Common Questions
What are the Top Zip Codes with the Highest Percentage of Population Employed in Security & Protection in Lawrence, MA?
Top Zip Codes with the Highest Percentage of Population Employed in Security & Protection in Lawrence, MA are:
What zip code has the Highest Percentage of Population Employed in Security & Protection in Lawrence, MA?
01840 has the Highest Percentage of Population Employed in Security & Protection in Lawrence, MA with 5.3%.
What is the Percentage of Population Employed in Security & Protection in Lawrence, MA?
Percentage of Population Employed in Security & Protection in Lawrence is 1.8%.
What is the Percentage of Population Employed in Security & Protection in Massachusetts?
Percentage of Population Employed in Security & Protection in Massachusetts is 2.0%.
What is the Percentage of Population Employed in Security & Protection in the United States?
Percentage of Population Employed in Security & Protection in the United States is 2.1%.