Zip Codes with the Highest Percentage of Households Without a Vehicle in Lawrence, MA
RELATED REPORTS & OPTIONS
Households without a Cars
Lawrence
Compare Zip Codes
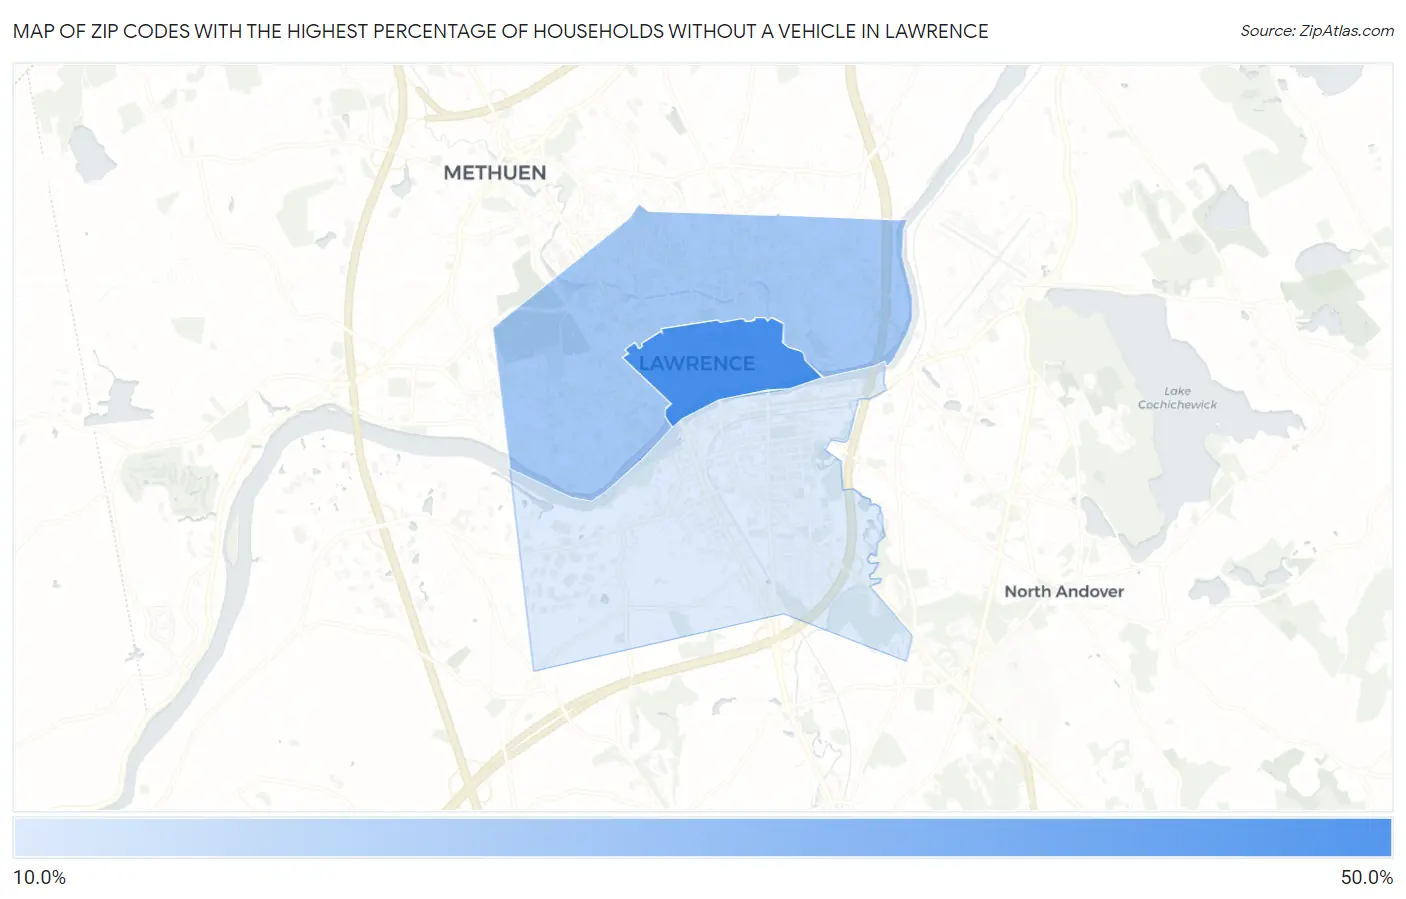
Map of Zip Codes with the Highest Percentage of Households Without a Vehicle in Lawrence
0.0%
50.0%
Zip Codes with the Highest Percentage of Households Without a Vehicle in Lawrence, MA
| Zip Code | Housholds Without a Car | vs State | vs National | |
| 1. | 01840 | 42.3% | 11.9%(+30.4)#16 | 8.3%(+34.0)#468 |
| 2. | 01841 | 24.3% | 11.9%(+12.4)#44 | 8.3%(+16.0)#1,109 |
| 3. | 01843 | 14.3% | 11.9%(+2.40)#79 | 8.3%(+6.00)#2,590 |
1
Common Questions
What are the Top Zip Codes with the Highest Percentage of Households Without a Vehicle in Lawrence, MA?
Top Zip Codes with the Highest Percentage of Households Without a Vehicle in Lawrence, MA are:
What zip code has the Highest Percentage of Households Without a Vehicle in Lawrence, MA?
01840 has the Highest Percentage of Households Without a Vehicle in Lawrence, MA with 42.3%.
What is the Percentage of Households Without a Vehicle in Lawrence, MA?
Percentage of Households Without a Vehicle in Lawrence is 22.8%.
What is the Percentage of Households Without a Vehicle in Massachusetts?
Percentage of Households Without a Vehicle in Massachusetts is 11.9%.
What is the Percentage of Households Without a Vehicle in the United States?
Percentage of Households Without a Vehicle in the United States is 8.3%.