Zip Codes with the Highest Percentage of Households Heated by Bottled Gas / Liquid Propane in Lawrence, MA
RELATED REPORTS & OPTIONS
Bottled Gas / LP Heating
Lawrence
Compare Zip Codes
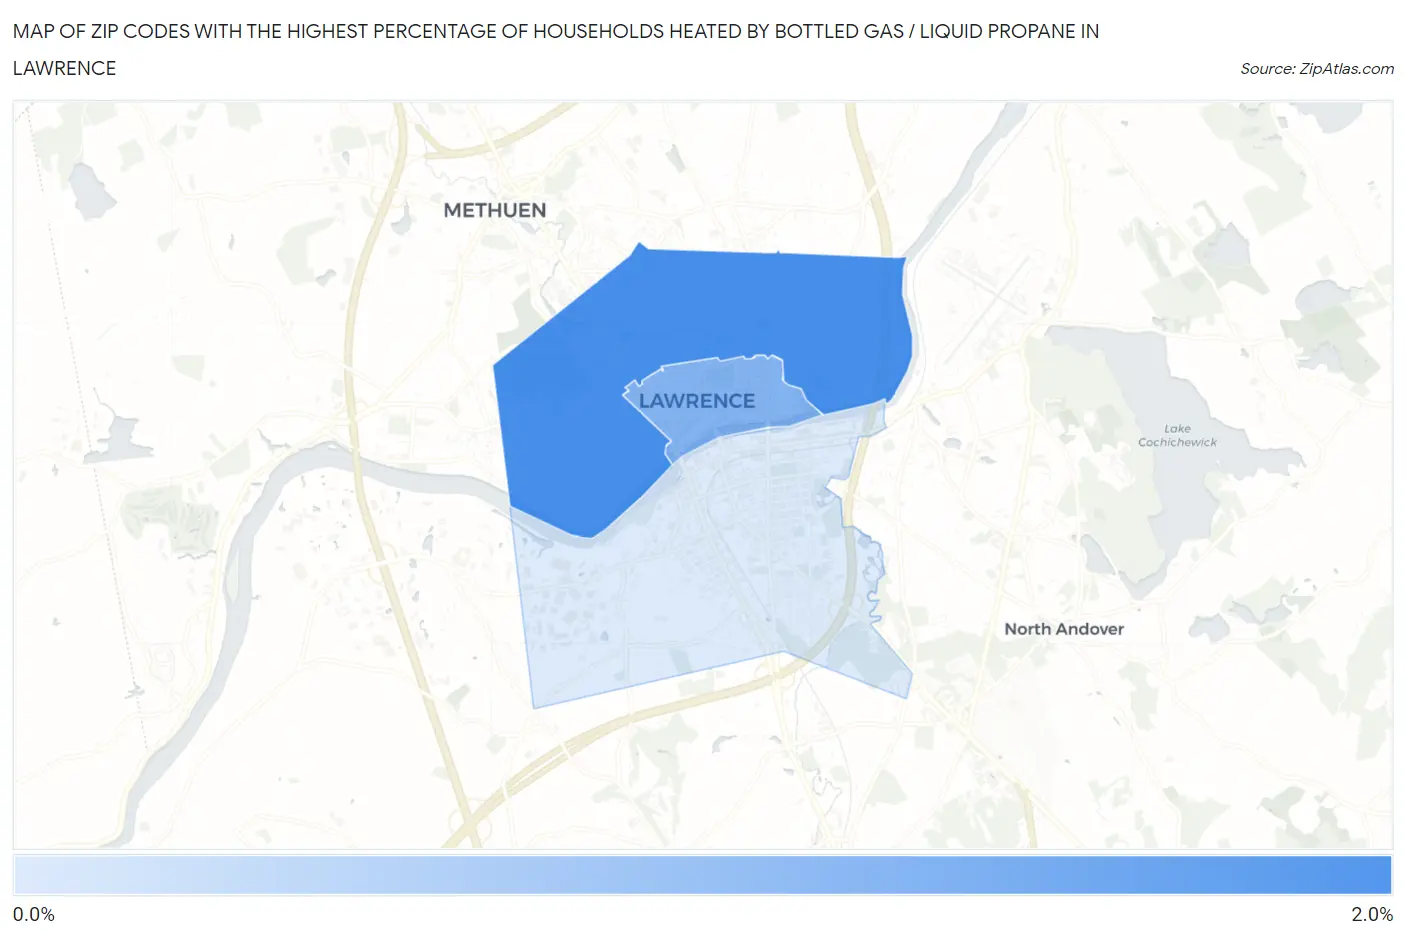
Map of Zip Codes with the Highest Percentage of Households Heated by Bottled Gas / Liquid Propane in Lawrence
0.0%
2.0%
Zip Codes with the Highest Percentage of Households Heated by Bottled Gas / Liquid Propane in Lawrence, MA
| Zip Code | Bottled Gas / LP Heating | vs State | vs National | |
| 1. | 01841 | 1.7% | 4.2%(-2.50)#435 | 4.9%(-3.20)#23,952 |
| 2. | 01840 | 1.3% | 4.2%(-2.90)#464 | 4.9%(-3.60)#25,652 |
| 3. | 01843 | 0.70% | 4.2%(-3.50)#486 | 4.9%(-4.20)#27,874 |
1
Common Questions
What are the Top Zip Codes with the Highest Percentage of Households Heated by Bottled Gas / Liquid Propane in Lawrence, MA?
Top Zip Codes with the Highest Percentage of Households Heated by Bottled Gas / Liquid Propane in Lawrence, MA are:
What zip code has the Highest Percentage of Households Heated by Bottled Gas / Liquid Propane in Lawrence, MA?
01841 has the Highest Percentage of Households Heated by Bottled Gas / Liquid Propane in Lawrence, MA with 1.7%.
What is the Percentage of Households Heated by Bottled Gas / Liquid Propane in Lawrence, MA?
Percentage of Households Heated by Bottled Gas / Liquid Propane in Lawrence is 1.3%.
What is the Percentage of Households Heated by Bottled Gas / Liquid Propane in Massachusetts?
Percentage of Households Heated by Bottled Gas / Liquid Propane in Massachusetts is 4.2%.
What is the Percentage of Households Heated by Bottled Gas / Liquid Propane in the United States?
Percentage of Households Heated by Bottled Gas / Liquid Propane in the United States is 4.9%.