Zip Codes with the Highest Percentage of Population with a Degree in Liberal Arts and History in Lexington, KY
RELATED REPORTS & OPTIONS
Liberal Arts and History
Lexington
Compare Zip Codes
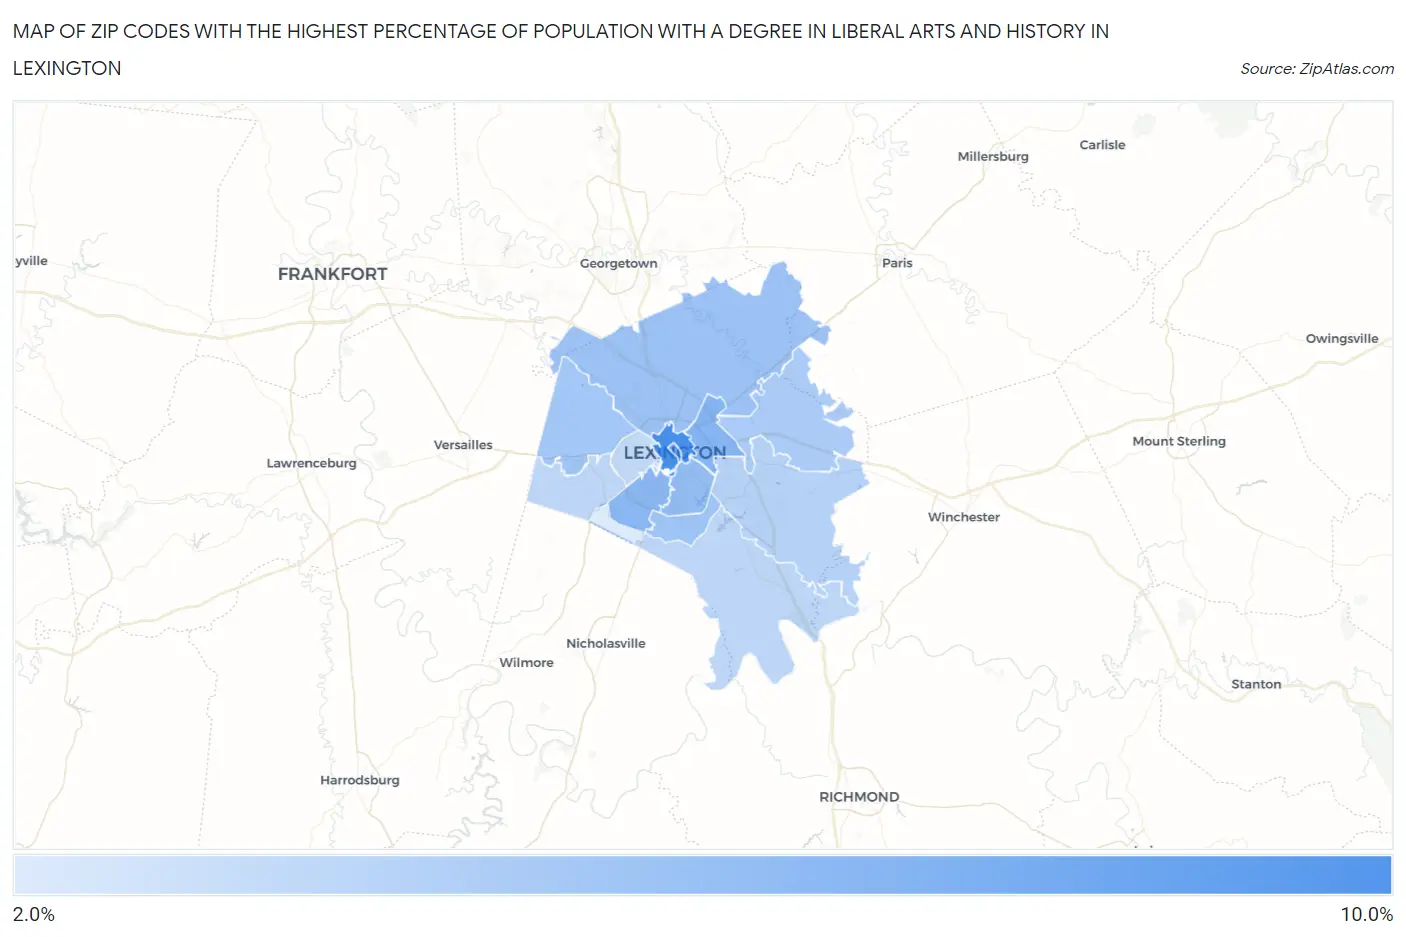
Map of Zip Codes with the Highest Percentage of Population with a Degree in Liberal Arts and History in Lexington
0.0%
10.0%
Zip Codes with the Highest Percentage of Population with a Degree in Liberal Arts and History in Lexington, KY
| Zip Code | % Graduates | vs State | vs National | |
| 1. | 40508 | 9.7% | 5.3%(+4.33)#90 | 4.9%(+4.79)#3,330 |
| 2. | 40507 | 7.8% | 5.3%(+2.51)#128 | 4.9%(+2.97)#5,101 |
| 3. | 40505 | 6.8% | 5.3%(+1.44)#162 | 4.9%(+1.90)#6,790 |
| 4. | 40503 | 6.5% | 5.3%(+1.20)#167 | 4.9%(+1.66)#7,283 |
| 5. | 40502 | 6.1% | 5.3%(+0.756)#180 | 4.9%(+1.21)#8,300 |
| 6. | 40511 | 5.7% | 5.3%(+0.399)#192 | 4.9%(+0.857)#9,216 |
| 7. | 40517 | 5.5% | 5.3%(+0.179)#203 | 4.9%(+0.637)#9,846 |
| 8. | 40510 | 5.3% | 5.3%(-0.024)#212 | 4.9%(+0.434)#10,426 |
| 9. | 40516 | 5.0% | 5.3%(-0.366)#227 | 4.9%(+0.092)#11,456 |
| 10. | 40509 | 4.5% | 5.3%(-0.878)#252 | 4.9%(-0.420)#13,115 |
| 11. | 40515 | 4.2% | 5.3%(-1.18)#266 | 4.9%(-0.719)#14,199 |
| 12. | 40513 | 4.1% | 5.3%(-1.20)#270 | 4.9%(-0.737)#14,261 |
| 13. | 40504 | 3.9% | 5.3%(-1.43)#290 | 4.9%(-0.976)#15,181 |
| 14. | 40514 | 2.7% | 5.3%(-2.62)#335 | 4.9%(-2.17)#19,286 |
1
Common Questions
What are the Top 10 Zip Codes with the Highest Percentage of Population with a Degree in Liberal Arts and History in Lexington, KY?
Top 10 Zip Codes with the Highest Percentage of Population with a Degree in Liberal Arts and History in Lexington, KY are:
What zip code has the Highest Percentage of Population with a Degree in Liberal Arts and History in Lexington, KY?
40508 has the Highest Percentage of Population with a Degree in Liberal Arts and History in Lexington, KY with 9.7%.
What is the Percentage of Population with a Degree in Liberal Arts and History in Lexington, KY?
Percentage of Population with a Degree in Liberal Arts and History in Lexington is 5.2%.
What is the Percentage of Population with a Degree in Liberal Arts and History in Kentucky?
Percentage of Population with a Degree in Liberal Arts and History in Kentucky is 5.3%.
What is the Percentage of Population with a Degree in Liberal Arts and History in the United States?
Percentage of Population with a Degree in Liberal Arts and History in the United States is 4.9%.