Portuguese vs Nepalese Median Female Earnings
COMPARE
Portuguese
Nepalese
Median Female Earnings
Median Female Earnings Comparison
Portuguese
Nepalese
$40,177
MEDIAN FEMALE EARNINGS
73.0/ 100
METRIC RATING
157th/ 347
METRIC RANK
$38,603
MEDIAN FEMALE EARNINGS
9.3/ 100
METRIC RATING
219th/ 347
METRIC RANK
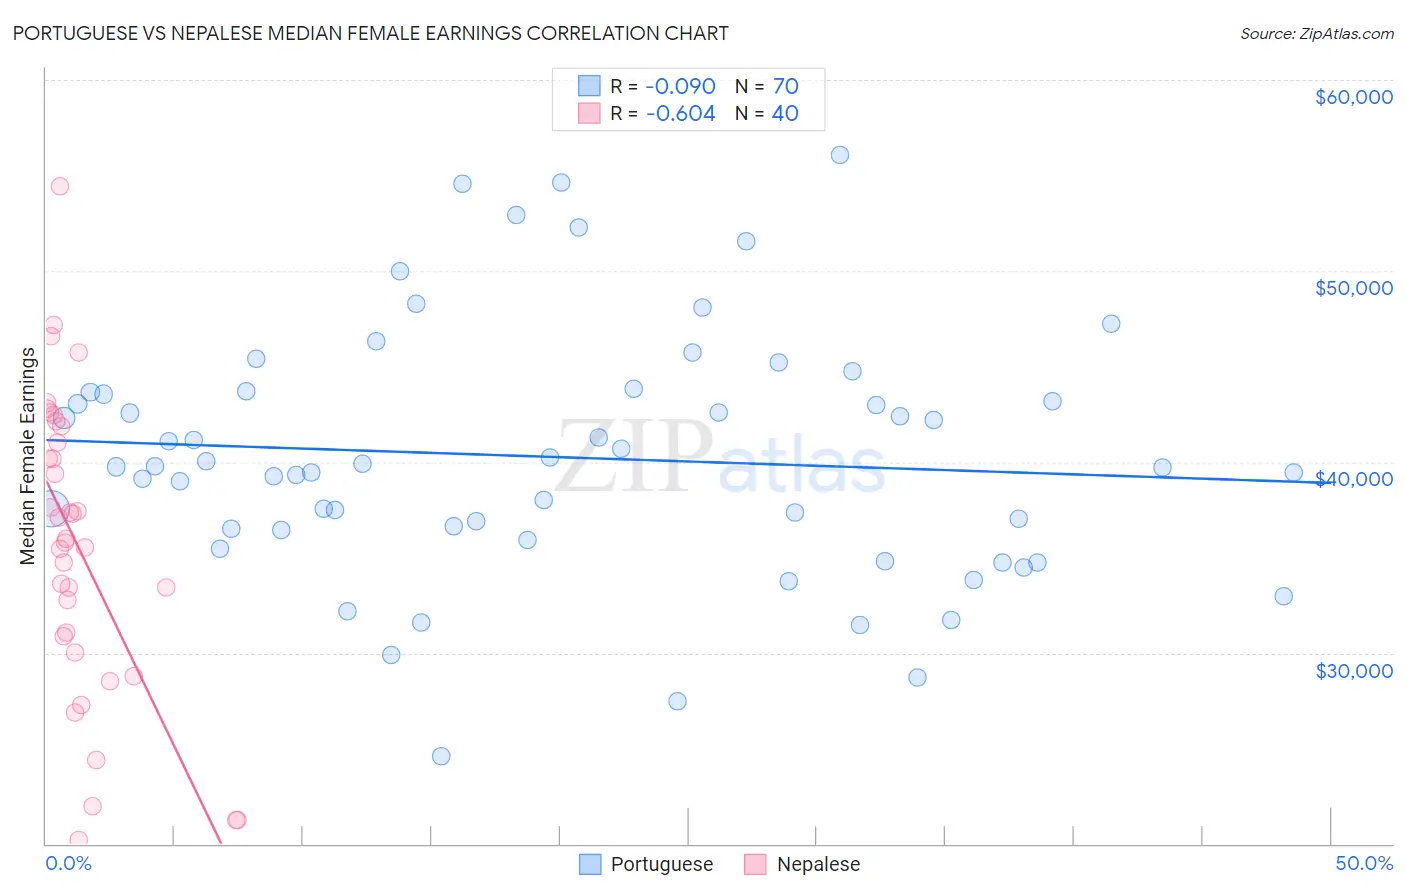
Portuguese vs Nepalese Median Female Earnings Correlation Chart
The statistical analysis conducted on geographies consisting of 449,940,574 people shows a slight negative correlation between the proportion of Portuguese and median female earnings in the United States with a correlation coefficient (R) of -0.090 and weighted average of $40,177. Similarly, the statistical analysis conducted on geographies consisting of 24,521,755 people shows a significant negative correlation between the proportion of Nepalese and median female earnings in the United States with a correlation coefficient (R) of -0.604 and weighted average of $38,603, a difference of 4.1%.
Median Female Earnings Correlation Summary
| Measurement | Portuguese | Nepalese |
| Minimum | $24,606 | $20,210 |
| Maximum | $56,053 | $54,407 |
| Range | $31,447 | $34,197 |
| Mean | $40,249 | $35,483 |
| Median | $39,749 | $35,860 |
| Interquartile 25% (IQ1) | $36,452 | $30,426 |
| Interquartile 75% (IQ3) | $43,632 | $41,423 |
| Interquartile Range (IQR) | $7,179 | $10,997 |
| Standard Deviation (Sample) | $6,533 | $7,837 |
| Standard Deviation (Population) | $6,486 | $7,738 |
Similar Demographics by Median Female Earnings
Demographics Similar to Portuguese by Median Female Earnings
In terms of median female earnings, the demographic groups most similar to Portuguese are Immigrants from Senegal ($40,157, a difference of 0.050%), Immigrants from Vietnam ($40,153, a difference of 0.060%), Peruvian ($40,234, a difference of 0.14%), Immigrants from Africa ($40,257, a difference of 0.20%), and Inupiat ($40,080, a difference of 0.24%).
| Demographics | Rating | Rank | Median Female Earnings |
| Immigrants | Chile | 79.6 /100 | #150 | Good $40,353 |
| Immigrants | Armenia | 79.2 /100 | #151 | Good $40,340 |
| West Indians | 78.4 /100 | #152 | Good $40,317 |
| British West Indians | 77.7 /100 | #153 | Good $40,299 |
| Immigrants | Oceania | 77.6 /100 | #154 | Good $40,297 |
| Immigrants | Africa | 76.2 /100 | #155 | Good $40,257 |
| Peruvians | 75.3 /100 | #156 | Good $40,234 |
| Portuguese | 73.0 /100 | #157 | Good $40,177 |
| Immigrants | Senegal | 72.2 /100 | #158 | Good $40,157 |
| Immigrants | Vietnam | 72.0 /100 | #159 | Good $40,153 |
| Inupiat | 68.9 /100 | #160 | Good $40,080 |
| Alsatians | 68.0 /100 | #161 | Good $40,060 |
| South American Indians | 66.1 /100 | #162 | Good $40,019 |
| Lebanese | 65.5 /100 | #163 | Good $40,006 |
| Immigrants | Saudi Arabia | 62.9 /100 | #164 | Good $39,952 |
Demographics Similar to Nepalese by Median Female Earnings
In terms of median female earnings, the demographic groups most similar to Nepalese are Cape Verdean ($38,614, a difference of 0.030%), Immigrants from Jamaica ($38,625, a difference of 0.060%), Yugoslavian ($38,573, a difference of 0.080%), Immigrants from the Azores ($38,573, a difference of 0.080%), and Immigrants from Ecuador ($38,644, a difference of 0.11%).
| Demographics | Rating | Rank | Median Female Earnings |
| Guamanians/Chamorros | 11.5 /100 | #212 | Poor $38,717 |
| Jamaicans | 10.5 /100 | #213 | Poor $38,670 |
| Iraqis | 10.5 /100 | #214 | Poor $38,666 |
| Spaniards | 10.3 /100 | #215 | Poor $38,656 |
| Immigrants | Ecuador | 10.1 /100 | #216 | Poor $38,644 |
| Immigrants | Jamaica | 9.7 /100 | #217 | Tragic $38,625 |
| Cape Verdeans | 9.5 /100 | #218 | Tragic $38,614 |
| Nepalese | 9.3 /100 | #219 | Tragic $38,603 |
| Yugoslavians | 8.8 /100 | #220 | Tragic $38,573 |
| Immigrants | Azores | 8.8 /100 | #221 | Tragic $38,573 |
| Japanese | 8.1 /100 | #222 | Tragic $38,528 |
| Immigrants | Sudan | 7.8 /100 | #223 | Tragic $38,511 |
| Native Hawaiians | 7.1 /100 | #224 | Tragic $38,461 |
| French | 7.0 /100 | #225 | Tragic $38,457 |
| French Canadians | 6.8 /100 | #226 | Tragic $38,436 |