European vs Alsatian Wage/Income Gap
COMPARE
European
Alsatian
Wage/Income Gap
Wage/Income Gap Comparison
Europeans
Alsatians
29.4%
WAGE/INCOME GAP
0.0/ 100
METRIC RATING
333rd/ 347
METRIC RANK
24.7%
WAGE/INCOME GAP
93.2/ 100
METRIC RATING
130th/ 347
METRIC RANK
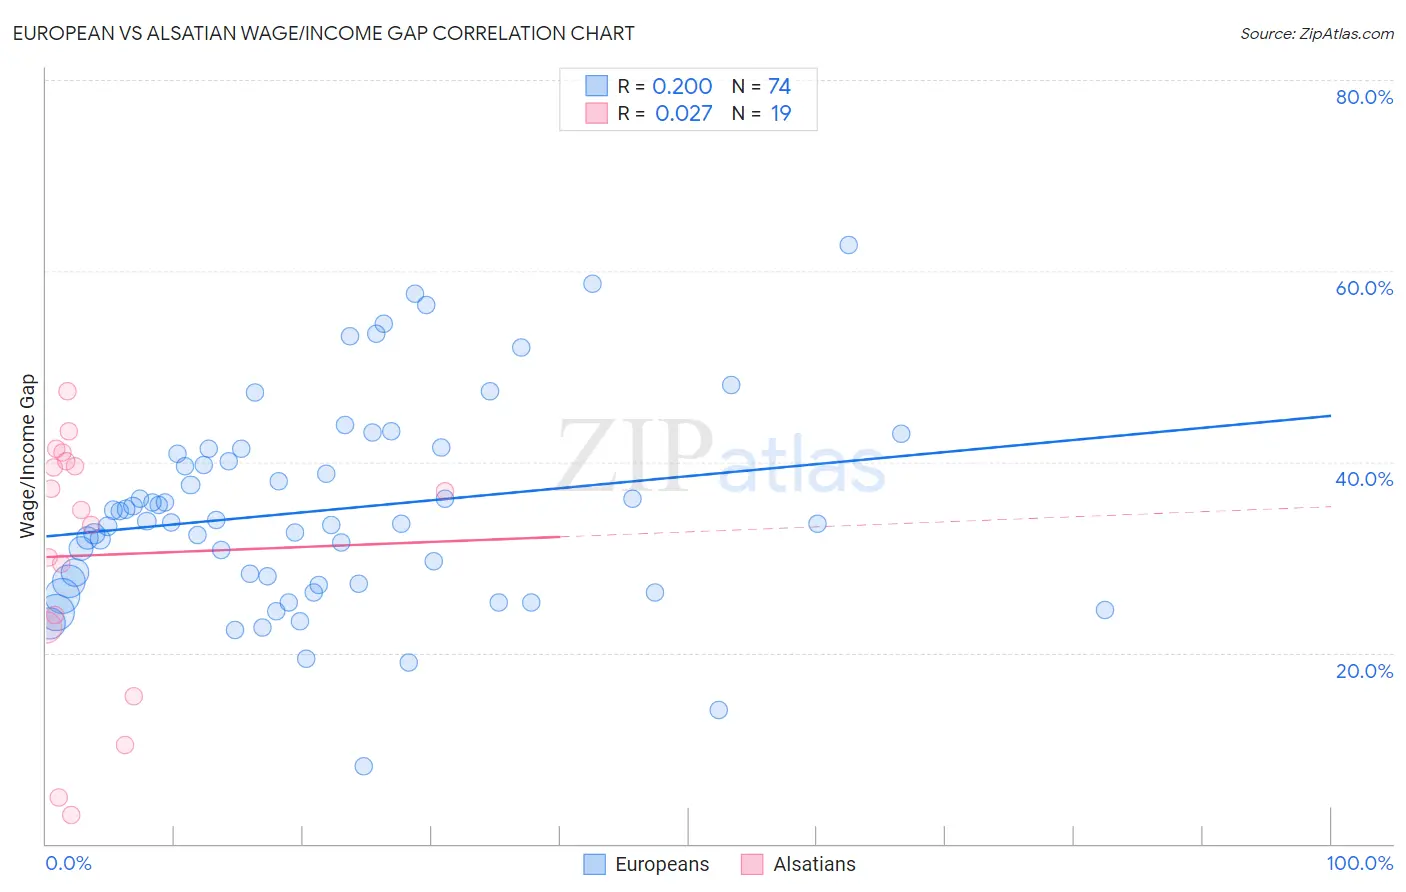
European vs Alsatian Wage/Income Gap Correlation Chart
The statistical analysis conducted on geographies consisting of 559,619,805 people shows a weak positive correlation between the proportion of Europeans and wage/income gap percentage in the United States with a correlation coefficient (R) of 0.200 and weighted average of 29.4%. Similarly, the statistical analysis conducted on geographies consisting of 82,663,210 people shows no correlation between the proportion of Alsatians and wage/income gap percentage in the United States with a correlation coefficient (R) of 0.027 and weighted average of 24.7%, a difference of 19.1%.
Wage/Income Gap Correlation Summary
| Measurement | European | Alsatian |
| Minimum | 8.1% | 3.0% |
| Maximum | 62.8% | 47.4% |
| Range | 54.6% | 44.4% |
| Mean | 34.9% | 30.2% |
| Median | 33.8% | 35.0% |
| Interquartile 25% (IQ1) | 27.2% | 22.7% |
| Interquartile 75% (IQ3) | 40.8% | 40.1% |
| Interquartile Range (IQR) | 13.6% | 17.4% |
| Standard Deviation (Sample) | 10.6% | 13.3% |
| Standard Deviation (Population) | 10.5% | 13.0% |
Similar Demographics by Wage/Income Gap
Demographics Similar to Europeans by Wage/Income Gap
In terms of wage/income gap, the demographic groups most similar to Europeans are Swedish (29.4%, a difference of 0.14%), Immigrants from South Central Asia (29.3%, a difference of 0.19%), Immigrants from Taiwan (29.5%, a difference of 0.27%), English (29.5%, a difference of 0.28%), and Czech (29.2%, a difference of 0.70%).
| Demographics | Rating | Rank | Wage/Income Gap |
| Immigrants | Belgium | 0.0 /100 | #326 | Tragic 29.0% |
| Immigrants | Iran | 0.0 /100 | #327 | Tragic 29.1% |
| Scandinavians | 0.0 /100 | #328 | Tragic 29.1% |
| Scottish | 0.0 /100 | #329 | Tragic 29.1% |
| Germans | 0.0 /100 | #330 | Tragic 29.2% |
| Czechs | 0.0 /100 | #331 | Tragic 29.2% |
| Immigrants | South Central Asia | 0.0 /100 | #332 | Tragic 29.3% |
| Europeans | 0.0 /100 | #333 | Tragic 29.4% |
| Swedes | 0.0 /100 | #334 | Tragic 29.4% |
| Immigrants | Taiwan | 0.0 /100 | #335 | Tragic 29.5% |
| English | 0.0 /100 | #336 | Tragic 29.5% |
| Dutch | 0.0 /100 | #337 | Tragic 29.6% |
| Filipinos | 0.0 /100 | #338 | Tragic 29.7% |
| Iranians | 0.0 /100 | #339 | Tragic 29.7% |
| Swiss | 0.0 /100 | #340 | Tragic 30.0% |
Demographics Similar to Alsatians by Wage/Income Gap
In terms of wage/income gap, the demographic groups most similar to Alsatians are Yup'ik (24.7%, a difference of 0.020%), Immigrants from Philippines (24.7%, a difference of 0.070%), Immigrants from Central America (24.6%, a difference of 0.080%), German Russian (24.6%, a difference of 0.14%), and Immigrants from Uruguay (24.6%, a difference of 0.15%).
| Demographics | Rating | Rank | Wage/Income Gap |
| Natives/Alaskans | 94.6 /100 | #123 | Exceptional 24.6% |
| Immigrants | South America | 93.9 /100 | #124 | Exceptional 24.6% |
| Spanish Americans | 93.8 /100 | #125 | Exceptional 24.6% |
| Immigrants | Uruguay | 93.8 /100 | #126 | Exceptional 24.6% |
| German Russians | 93.7 /100 | #127 | Exceptional 24.6% |
| Immigrants | Central America | 93.5 /100 | #128 | Exceptional 24.6% |
| Yup'ik | 93.3 /100 | #129 | Exceptional 24.7% |
| Alsatians | 93.2 /100 | #130 | Exceptional 24.7% |
| Immigrants | Philippines | 93.0 /100 | #131 | Exceptional 24.7% |
| Immigrants | Costa Rica | 92.4 /100 | #132 | Exceptional 24.7% |
| Colombians | 92.4 /100 | #133 | Exceptional 24.7% |
| Mexican American Indians | 92.2 /100 | #134 | Exceptional 24.7% |
| South American Indians | 92.0 /100 | #135 | Exceptional 24.7% |
| Armenians | 91.3 /100 | #136 | Exceptional 24.8% |
| Immigrants | South Eastern Asia | 90.9 /100 | #137 | Exceptional 24.8% |