Bangladeshi vs Central American Wage/Income Gap

COMPARE

Bangladeshi
Race
Ancestry
AfghanAfricanAlaska NativeAlaskan AthabascanAlbanianAleutAlsatianAmericanApacheArabArapahoArgentineanArmenianAssyrian/Chaldean/SyriacAustralianAustrianBahamianBangladeshiBarbadianBasqueBelgianBelizeanBermudanBhutaneseBlackfeetBolivianBrazilianBritishBritish West IndianBulgarianBurmeseCajunCambodianCanadianCape VerdeanCarpatho RusynCelticCentral American IndianCherokeeCheyenneChickasawChileanChineseChippewaChoctawColombianColvilleComancheCosta RicanCreeCreekCroatianCrowCubanCypriotCzechCzechoslovakianDanishDelawareDominicanDutchDutch West IndianEastern EuropeanEcuadorianEgyptianEnglishEstonianEthiopianEuropeanFijianFilipinoFinnishFrenchFrench American IndianFrench CanadianGermanGerman RussianGhanaianGreekGuamanian/ChamorroGuatemalanGuyaneseHaitianHmongHonduranHopiHoumaHungarianIcelanderIndian (Asian)IndonesianInupiatIranianIraqiIrishIroquoisIsraeliItalianJamaicanJapaneseJordanianKenyanKiowaKoreanLaotianLatvianLebaneseLiberianLithuanianLumbeeLuxembourgerMacedonianMalaysianMalteseMarshalleseMenomineeMexicanMexican American IndianMongolianMoroccanNative HawaiianNavajoNepaleseNew ZealanderNicaraguanNigerianNorthern EuropeanNorwegianOkinawanOsageOttawaPaiutePakistaniPalestinianPanamanianParaguayanPennsylvania GermanPeruvianPimaPolishPortuguesePotawatomiPuebloPuerto RicanPuget Sound SalishRomanianRussianSalvadoranSamoanScandinavianScotch-IrishScottishSeminoleSenegaleseSerbianShoshoneSierra LeoneanSiouxSlavicSlovakSloveneSomaliSouth AfricanSouth AmericanSouth American IndianSoviet UnionSpaniardSpanishSpanish AmericanSpanish American IndianSri LankanSubsaharan AfricanSudaneseSwedishSwissSyrianTaiwaneseThaiTlingit-HaidaTohono O'OdhamTonganTrinidadian and TobagonianTsimshianTurkishU.S. Virgin IslanderUgandanUkrainianUruguayanUteVenezuelanVietnameseWelshWest IndianYakamaYaquiYugoslavianYumanYup'ikZimbabwean
Immigration
NonimmigrantsImmigrantsAfghanistanAfricaAlbaniaArgentinaArmeniaAsiaAustraliaAustriaBahamasBangladeshBarbadosBelarusBelgiumBelizeBoliviaBosnia and HerzegovinaBrazilBulgariaBurma/MyanmarCabo VerdeCambodiaCameroonCanadaCaribbeanCentral AmericaChileChinaColombiaCongoCosta RicaCroatiaCubaCzechoslovakiaDenmarkDominicaDominican RepublicEastern AfricaEastern AsiaEastern EuropeEcuadorEgyptEl SalvadorEnglandEritreaEthiopiaEuropeFijiFranceGermanyGhanaGreeceGrenadaGuatemalaGuyanaHaitiHondurasHong KongHungaryIndiaIndonesiaIranIraqIrelandIsraelItalyJamaicaJapanJordanKazakhstanKenyaKoreaKuwaitLaosLatin AmericaLatviaLebanonLiberiaLithuaniaMalaysiaMexicoMicronesiaMiddle AfricaMoldovaMoroccoNepalNetherlandsNicaraguaNigeriaNorth AmericaNorth MacedoniaNorthern AfricaNorthern EuropeNorwayOceaniaPakistanPanamaPeruPhilippinesPolandPortugalRomaniaRussiaSaudi ArabiaScotlandSenegalSerbiaSierra LeoneSingaporeSomaliaSouth AfricaSouth AmericaSouth Central AsiaSouth Eastern AsiaSouthern EuropeSpainSri LankaSt. Vincent and the GrenadinesSudanSwedenSwitzerlandSyriaTaiwanThailandTrinidad and TobagoTurkeyUgandaUkraineUruguayUzbekistanVenezuelaVietnamWest IndiesWestern AfricaWestern AsiaWestern EuropeYemenZaireZimbabweAzores
Central American
Race
Ancestry
AfghanAfricanAlaska NativeAlaskan AthabascanAlbanianAleutAlsatianAmericanApacheArabArapahoArgentineanArmenianAssyrian/Chaldean/SyriacAustralianAustrianBahamianBarbadianBasqueBelgianBelizeanBermudanBhutaneseBlackfeetBolivianBrazilianBritishBritish West IndianBulgarianBurmeseCajunCambodianCanadianCape VerdeanCarpatho RusynCelticCentral AmericanCentral American IndianCherokeeCheyenneChickasawChileanChineseChippewaChoctawColombianColvilleComancheCosta RicanCreeCreekCroatianCrowCubanCypriotCzechCzechoslovakianDanishDelawareDominicanDutchDutch West IndianEastern EuropeanEcuadorianEgyptianEnglishEstonianEthiopianEuropeanFijianFilipinoFinnishFrenchFrench American IndianFrench CanadianGermanGerman RussianGhanaianGreekGuamanian/ChamorroGuatemalanGuyaneseHaitianHmongHonduranHopiHoumaHungarianIcelanderIndian (Asian)IndonesianInupiatIranianIraqiIrishIroquoisIsraeliItalianJamaicanJapaneseJordanianKenyanKiowaKoreanLaotianLatvianLebaneseLiberianLithuanianLumbeeLuxembourgerMacedonianMalaysianMalteseMarshalleseMenomineeMexicanMexican American IndianMongolianMoroccanNative HawaiianNavajoNepaleseNew ZealanderNicaraguanNigerianNorthern EuropeanNorwegianOkinawanOsageOttawaPaiutePakistaniPalestinianPanamanianParaguayanPennsylvania GermanPeruvianPimaPolishPortuguesePotawatomiPuebloPuerto RicanPuget Sound SalishRomanianRussianSalvadoranSamoanScandinavianScotch-IrishScottishSeminoleSenegaleseSerbianShoshoneSierra LeoneanSiouxSlavicSlovakSloveneSomaliSouth AfricanSouth AmericanSouth American IndianSoviet UnionSpaniardSpanishSpanish AmericanSpanish American IndianSri LankanSubsaharan AfricanSudaneseSwedishSwissSyrianTaiwaneseThaiTlingit-HaidaTohono O'OdhamTonganTrinidadian and TobagonianTsimshianTurkishU.S. Virgin IslanderUgandanUkrainianUruguayanUteVenezuelanVietnameseWelshWest IndianYakamaYaquiYugoslavianYumanYup'ikZimbabwean
Immigration
NonimmigrantsImmigrantsAfghanistanAfricaAlbaniaArgentinaArmeniaAsiaAustraliaAustriaBahamasBangladeshBarbadosBelarusBelgiumBelizeBoliviaBosnia and HerzegovinaBrazilBulgariaBurma/MyanmarCabo VerdeCambodiaCameroonCanadaCaribbeanCentral AmericaChileChinaColombiaCongoCosta RicaCroatiaCubaCzechoslovakiaDenmarkDominicaDominican RepublicEastern AfricaEastern AsiaEastern EuropeEcuadorEgyptEl SalvadorEnglandEritreaEthiopiaEuropeFijiFranceGermanyGhanaGreeceGrenadaGuatemalaGuyanaHaitiHondurasHong KongHungaryIndiaIndonesiaIranIraqIrelandIsraelItalyJamaicaJapanJordanKazakhstanKenyaKoreaKuwaitLaosLatin AmericaLatviaLebanonLiberiaLithuaniaMalaysiaMexicoMicronesiaMiddle AfricaMoldovaMoroccoNepalNetherlandsNicaraguaNigeriaNorth AmericaNorth MacedoniaNorthern AfricaNorthern EuropeNorwayOceaniaPakistanPanamaPeruPhilippinesPolandPortugalRomaniaRussiaSaudi ArabiaScotlandSenegalSerbiaSierra LeoneSingaporeSomaliaSouth AfricaSouth AmericaSouth Central AsiaSouth Eastern AsiaSouthern EuropeSpainSri LankaSt. Vincent and the GrenadinesSudanSwedenSwitzerlandSyriaTaiwanThailandTrinidad and TobagoTurkeyUgandaUkraineUruguayUzbekistanVenezuelaVietnamWest IndiesWestern AfricaWestern AsiaWestern EuropeYemenZaireZimbabweAzores
Wage/Income Gap
Income
Poverty
Unemployment
Labor Participation
Family Structure
Vehicle Availability
Education Level
Disability

Wage/Income Gap Comparison

Bangladeshis

Central Americans

Exceptional
Exceptional
22.2%
WAGE/INCOME GAP
100.0/ 100
METRIC RATING
53rd/ 347
METRIC RANK
23.1%
WAGE/INCOME GAP
99.8/ 100
METRIC RATING
82nd/ 347
METRIC RANK

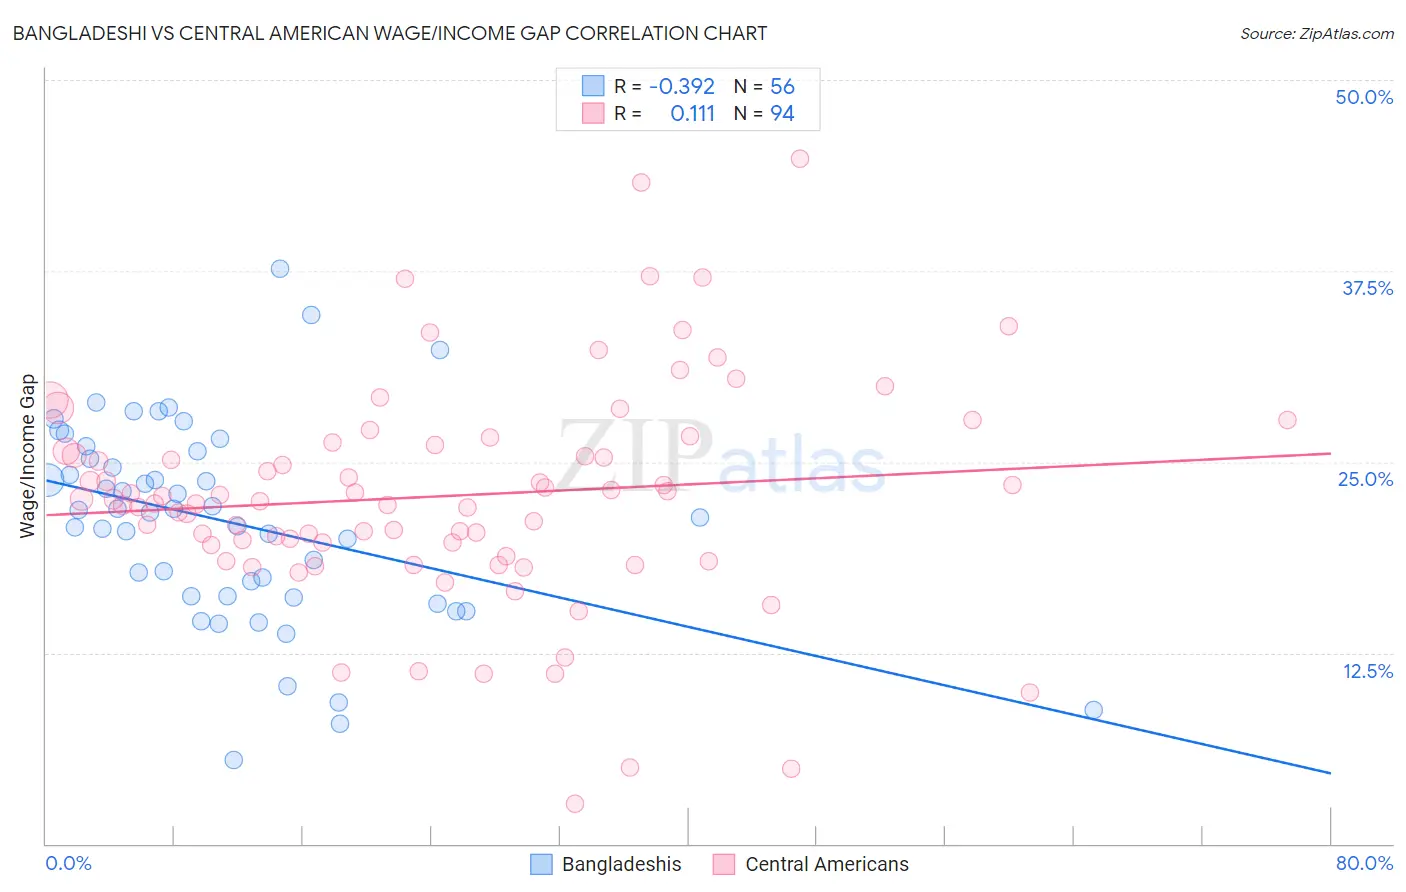
Bangladeshi vs Central American Wage/Income Gap Correlation Chart

The statistical analysis conducted on geographies consisting of 141,421,838 people shows a mild negative correlation between the proportion of Bangladeshis and wage/income gap percentage in the United States with a correlation coefficient (R) of -0.392 and weighted average of 22.2%. Similarly, the statistical analysis conducted on geographies consisting of 503,863,449 people shows a poor positive correlation between the proportion of Central Americans and wage/income gap percentage in the United States with a correlation coefficient (R) of 0.111 and weighted average of 23.1%, a difference of 4.3%.
Bangladeshi vs Central American Wage/Income Gap

Wage/Income Gap Correlation Summary

MeasurementBangladeshiCentral American
Minimum5.5%2.7%
Maximum37.6%44.8%
Range32.1%42.2%
Mean21.1%22.7%
Median21.8%22.5%
Interquartile 25% (IQ1)16.2%19.5%
Interquartile 75% (IQ3)25.4%26.1%
Interquartile Range (IQR)9.2%6.6%
Standard Deviation (Sample)6.5%7.2%
Standard Deviation (Population)6.5%7.2%

Similar Demographics by Wage/Income Gap

Demographics Similar to Bangladeshis by Wage/Income Gap

In terms of wage/income gap, the demographic groups most similar to Bangladeshis are Immigrants from Cameroon (22.2%, a difference of 0.010%), Tohono O'odham (22.1%, a difference of 0.10%), Nepalese (22.2%, a difference of 0.23%), Immigrants from Western Africa (22.0%, a difference of 0.53%), and Immigrants from Zaire (22.3%, a difference of 0.63%).
DemographicsRating | RankWage/Income Gap
Immigrants | Ethiopia
100.0
/100
|
#46
Exceptional
21.6%
Immigrants | Congo
100.0
/100
|
#47
Exceptional
21.7%
Blacks/African Americans
100.0
/100
|
#48
Exceptional
21.7%
Ethiopians
100.0
/100
|
#49
Exceptional
21.8%
Immigrants | Western Africa
100.0
/100
|
#50
Exceptional
22.0%
Tohono O'odham
100.0
/100
|
#51
Exceptional
22.1%
Immigrants | Cameroon
100.0
/100
|
#52
Exceptional
22.2%
Bangladeshis
100.0
/100
|
#53
Exceptional
22.2%
Nepalese
100.0
/100
|
#54
Exceptional
22.2%
Immigrants | Zaire
100.0
/100
|
#55
Exceptional
22.3%
Immigrants | Ghana
100.0
/100
|
#56
Exceptional
22.3%
Ghanaians
100.0
/100
|
#57
Exceptional
22.3%
Immigrants | Cuba
100.0
/100
|
#58
Exceptional
22.4%
Navajo
100.0
/100
|
#59
Exceptional
22.4%
Immigrants | Middle Africa
100.0
/100
|
#60
Exceptional
22.4%

Demographics Similar to Central Americans by Wage/Income Gap

In terms of wage/income gap, the demographic groups most similar to Central Americans are Bermudan (23.1%, a difference of 0.0%), Immigrants from Africa (23.2%, a difference of 0.29%), Salvadoran (23.0%, a difference of 0.47%), Immigrants from Nicaragua (23.0%, a difference of 0.54%), and Nigerian (23.0%, a difference of 0.62%).
DemographicsRating | RankWage/Income Gap
Fijians
99.9
/100
|
#75
Exceptional
22.9%
Ecuadorians
99.9
/100
|
#76
Exceptional
22.9%
Africans
99.9
/100
|
#77
Exceptional
22.9%
Nigerians
99.9
/100
|
#78
Exceptional
23.0%
Immigrants | Nicaragua
99.9
/100
|
#79
Exceptional
23.0%
Salvadorans
99.9
/100
|
#80
Exceptional
23.0%
Bermudans
99.8
/100
|
#81
Exceptional
23.1%
Central Americans
99.8
/100
|
#82
Exceptional
23.1%
Immigrants | Africa
99.8
/100
|
#83
Exceptional
23.2%
Cubans
99.7
/100
|
#84
Exceptional
23.3%
Immigrants | Cambodia
99.7
/100
|
#85
Exceptional
23.3%
Cheyenne
99.7
/100
|
#86
Exceptional
23.3%
Yuman
99.7
/100
|
#87
Exceptional
23.3%
Immigrants | Panama
99.6
/100
|
#88
Exceptional
23.4%
Marshallese
99.6
/100
|
#89
Exceptional
23.4%