Alaskan Athabascan vs Carpatho Rusyn Wage/Income Gap
COMPARE
Alaskan Athabascan
Carpatho Rusyn
Wage/Income Gap
Wage/Income Gap Comparison
Alaskan Athabascans
Carpatho Rusyns
25.8%
WAGE/INCOME GAP
50.0/ 100
METRIC RATING
174th/ 347
METRIC RANK
27.3%
WAGE/INCOME GAP
2.7/ 100
METRIC RATING
249th/ 347
METRIC RANK
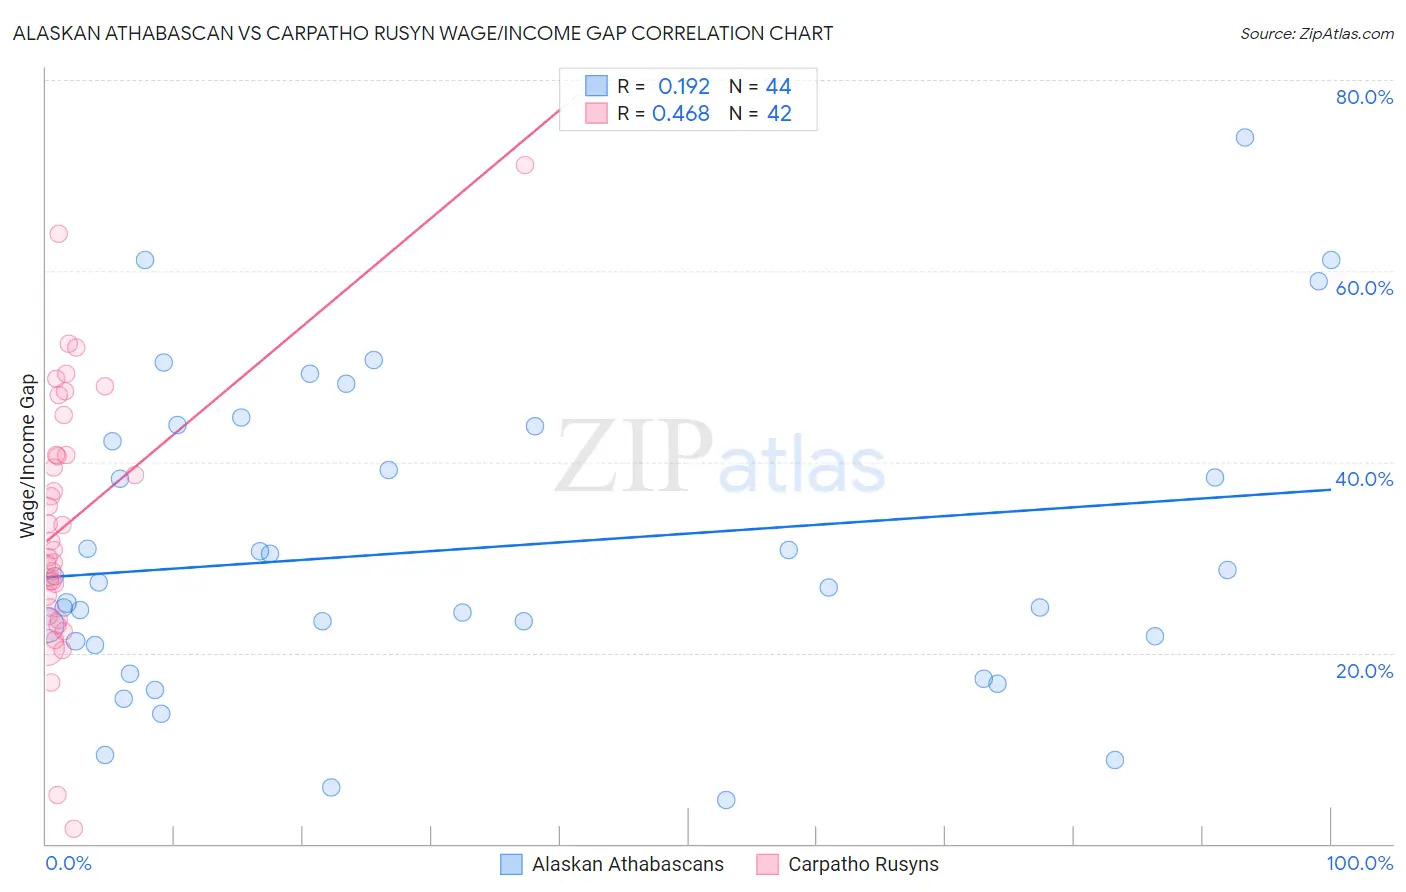
Alaskan Athabascan vs Carpatho Rusyn Wage/Income Gap Correlation Chart
The statistical analysis conducted on geographies consisting of 45,785,109 people shows a poor positive correlation between the proportion of Alaskan Athabascans and wage/income gap percentage in the United States with a correlation coefficient (R) of 0.192 and weighted average of 25.8%. Similarly, the statistical analysis conducted on geographies consisting of 58,862,775 people shows a moderate positive correlation between the proportion of Carpatho Rusyns and wage/income gap percentage in the United States with a correlation coefficient (R) of 0.468 and weighted average of 27.3%, a difference of 5.8%.
Wage/Income Gap Correlation Summary
| Measurement | Alaskan Athabascan | Carpatho Rusyn |
| Minimum | 4.5% | 1.6% |
| Maximum | 74.0% | 71.2% |
| Range | 69.5% | 69.5% |
| Mean | 30.9% | 33.8% |
| Median | 27.1% | 31.3% |
| Interquartile 25% (IQ1) | 21.0% | 24.7% |
| Interquartile 75% (IQ3) | 42.9% | 40.7% |
| Interquartile Range (IQR) | 21.9% | 16.0% |
| Standard Deviation (Sample) | 16.0% | 13.8% |
| Standard Deviation (Population) | 15.8% | 13.7% |
Similar Demographics by Wage/Income Gap
Demographics Similar to Alaskan Athabascans by Wage/Income Gap
In terms of wage/income gap, the demographic groups most similar to Alaskan Athabascans are Immigrants from Belarus (25.7%, a difference of 0.19%), Sri Lankan (25.8%, a difference of 0.20%), Immigrants from Chile (25.7%, a difference of 0.21%), Paraguayan (25.8%, a difference of 0.21%), and Cambodian (25.8%, a difference of 0.32%).
| Demographics | Rating | Rank | Wage/Income Gap |
| Paiute | 62.9 /100 | #167 | Good 25.5% |
| Seminole | 62.6 /100 | #168 | Good 25.6% |
| Peruvians | 60.1 /100 | #169 | Good 25.6% |
| Immigrants | Oceania | 57.5 /100 | #170 | Average 25.6% |
| Immigrants | Greece | 56.6 /100 | #171 | Average 25.7% |
| Immigrants | Chile | 53.2 /100 | #172 | Average 25.7% |
| Immigrants | Belarus | 52.9 /100 | #173 | Average 25.7% |
| Alaskan Athabascans | 50.0 /100 | #174 | Average 25.8% |
| Sri Lankans | 47.0 /100 | #175 | Average 25.8% |
| Paraguayans | 46.7 /100 | #176 | Average 25.8% |
| Cambodians | 45.1 /100 | #177 | Average 25.8% |
| Chinese | 42.0 /100 | #178 | Average 25.9% |
| Samoans | 38.6 /100 | #179 | Fair 26.0% |
| Guamanians/Chamorros | 38.0 /100 | #180 | Fair 26.0% |
| Immigrants | Bolivia | 36.4 /100 | #181 | Fair 26.0% |
Demographics Similar to Carpatho Rusyns by Wage/Income Gap
In terms of wage/income gap, the demographic groups most similar to Carpatho Rusyns are Cypriot (27.3%, a difference of 0.0%), Celtic (27.3%, a difference of 0.020%), Immigrants from Czechoslovakia (27.3%, a difference of 0.020%), Immigrants from Norway (27.3%, a difference of 0.12%), and Ukrainian (27.3%, a difference of 0.18%).
| Demographics | Rating | Rank | Wage/Income Gap |
| Immigrants | Sri Lanka | 3.7 /100 | #242 | Tragic 27.1% |
| Spanish | 3.6 /100 | #243 | Tragic 27.1% |
| Chickasaw | 3.5 /100 | #244 | Tragic 27.2% |
| Immigrants | Azores | 3.5 /100 | #245 | Tragic 27.2% |
| Immigrants | Nonimmigrants | 3.3 /100 | #246 | Tragic 27.2% |
| Celtics | 2.8 /100 | #247 | Tragic 27.3% |
| Cypriots | 2.8 /100 | #248 | Tragic 27.3% |
| Carpatho Rusyns | 2.7 /100 | #249 | Tragic 27.3% |
| Immigrants | Czechoslovakia | 2.7 /100 | #250 | Tragic 27.3% |
| Immigrants | Norway | 2.5 /100 | #251 | Tragic 27.3% |
| Ukrainians | 2.4 /100 | #252 | Tragic 27.3% |
| Portuguese | 2.2 /100 | #253 | Tragic 27.4% |
| Israelis | 2.1 /100 | #254 | Tragic 27.4% |
| Immigrants | France | 2.1 /100 | #255 | Tragic 27.4% |
| Cherokee | 1.9 /100 | #256 | Tragic 27.4% |