Zip Codes with the Highest Percentage of Population with a Degree in Education in Michigan
RELATED REPORTS & OPTIONS
Education
Michigan
Compare Zip Codes
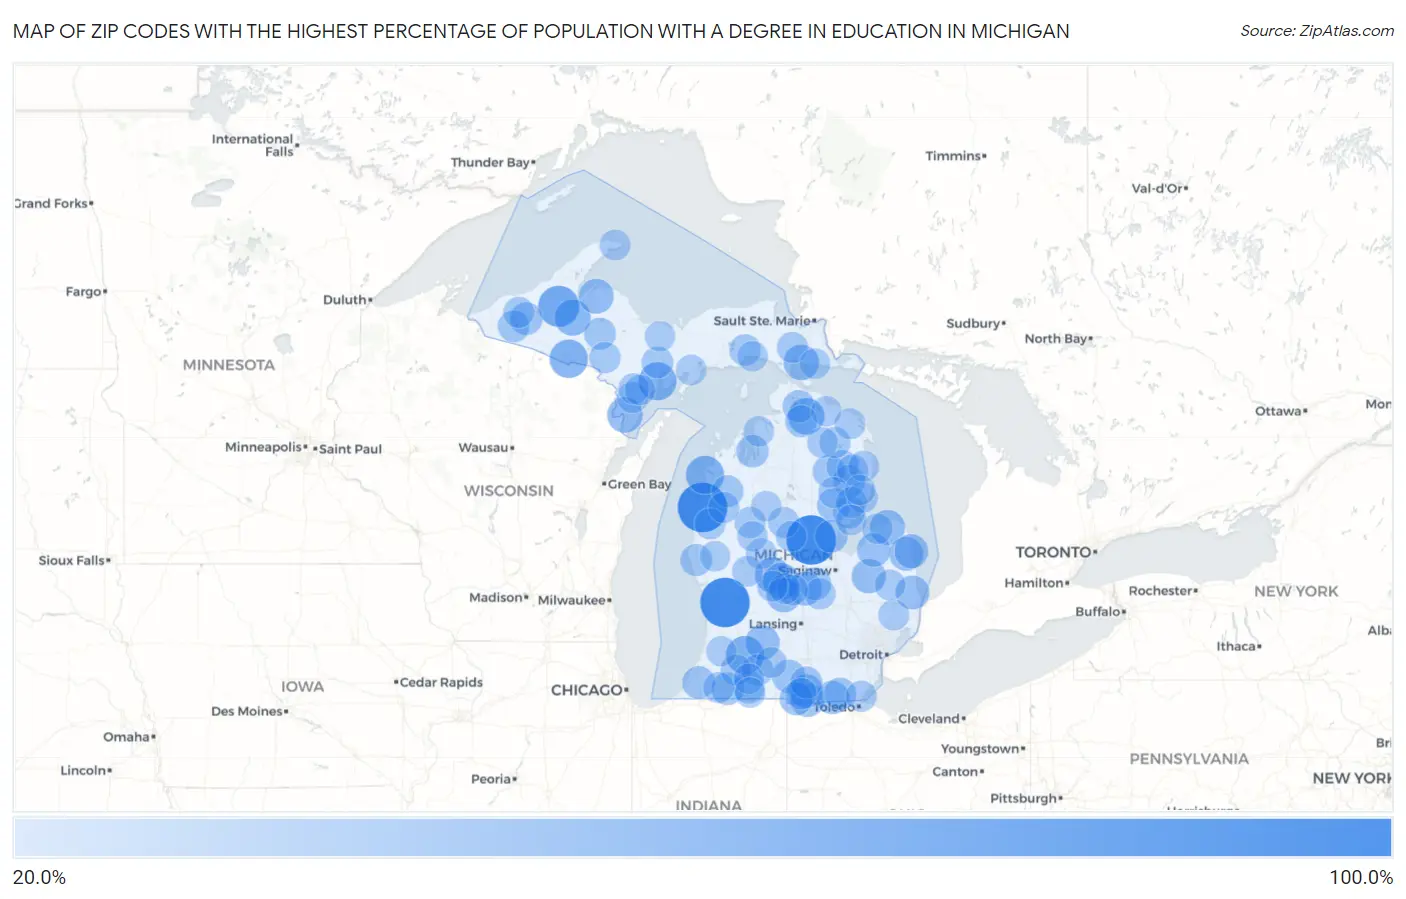
Map of Zip Codes with the Highest Percentage of Population with a Degree in Education in Michigan
0.0%
100.0%
Zip Codes with the Highest Percentage of Population with a Degree in Education in Michigan
| Zip Code | % Graduates | vs State | vs National | |
| 1. | 49634 | 100.0% | 12.7%(+87.3)#1 | 11.1%(+88.9)#162 |
| 2. | 48620 | 100.0% | 12.7%(+87.3)#2 | 11.1%(+88.9)#178 |
| 3. | 49430 | 100.0% | 12.7%(+87.3)#3 | 11.1%(+88.9)#264 |
| 4. | 49952 | 66.7% | 12.7%(+54.0)#4 | 11.1%(+55.6)#565 |
| 5. | 49628 | 56.2% | 12.7%(+43.5)#5 | 11.1%(+45.1)#882 |
| 6. | 49915 | 56.1% | 12.7%(+43.5)#6 | 11.1%(+45.1)#883 |
| 7. | 49894 | 55.6% | 12.7%(+42.9)#7 | 11.1%(+44.5)#897 |
| 8. | 49074 | 55.6% | 12.7%(+42.9)#8 | 11.1%(+44.5)#899 |
| 9. | 49705 | 49.2% | 12.7%(+36.5)#9 | 11.1%(+38.1)#1,272 |
| 10. | 48818 | 48.7% | 12.7%(+36.0)#10 | 11.1%(+37.6)#1,296 |
| 11. | 49970 | 48.6% | 12.7%(+36.0)#11 | 11.1%(+37.6)#1,299 |
| 12. | 49745 | 45.7% | 12.7%(+33.1)#12 | 11.1%(+34.7)#1,499 |
| 13. | 48852 | 45.5% | 12.7%(+32.8)#13 | 11.1%(+34.4)#1,523 |
| 14. | 49848 | 45.5% | 12.7%(+32.8)#14 | 11.1%(+34.4)#1,528 |
| 15. | 48445 | 43.8% | 12.7%(+31.2)#15 | 11.1%(+32.8)#1,680 |
| 16. | 49962 | 43.1% | 12.7%(+30.5)#16 | 11.1%(+32.1)#1,743 |
| 17. | 48845 | 42.3% | 12.7%(+29.6)#17 | 11.1%(+31.2)#1,834 |
| 18. | 49050 | 41.3% | 12.7%(+28.6)#18 | 11.1%(+30.2)#1,954 |
| 19. | 48744 | 41.1% | 12.7%(+28.5)#19 | 11.1%(+30.0)#1,980 |
| 20. | 48806 | 40.0% | 12.7%(+27.3)#20 | 11.1%(+28.9)#2,123 |
| 21. | 48465 | 40.0% | 12.7%(+27.3)#21 | 11.1%(+28.9)#2,133 |
| 22. | 48434 | 40.0% | 12.7%(+27.3)#22 | 11.1%(+28.9)#2,168 |
| 23. | 49288 | 39.6% | 12.7%(+27.0)#23 | 11.1%(+28.6)#2,214 |
| 24. | 48032 | 39.5% | 12.7%(+26.8)#24 | 11.1%(+28.4)#2,230 |
| 25. | 49271 | 39.4% | 12.7%(+26.7)#25 | 11.1%(+28.3)#2,239 |
| 26. | 48735 | 38.6% | 12.7%(+25.9)#26 | 11.1%(+27.5)#2,379 |
| 27. | 49248 | 37.4% | 12.7%(+24.7)#27 | 11.1%(+26.3)#2,595 |
| 28. | 48756 | 37.3% | 12.7%(+24.7)#28 | 11.1%(+26.3)#2,605 |
| 29. | 49252 | 37.1% | 12.7%(+24.5)#29 | 11.1%(+26.1)#2,637 |
| 30. | 49232 | 36.6% | 12.7%(+23.9)#30 | 11.1%(+25.5)#2,729 |
| 31. | 49925 | 35.1% | 12.7%(+22.4)#31 | 11.1%(+24.0)#2,995 |
| 32. | 48650 | 35.1% | 12.7%(+22.4)#32 | 11.1%(+24.0)#3,002 |
| 33. | 49104 | 34.8% | 12.7%(+22.1)#33 | 11.1%(+23.7)#3,078 |
| 34. | 49061 | 34.6% | 12.7%(+21.9)#34 | 11.1%(+23.5)#3,127 |
| 35. | 49629 | 34.4% | 12.7%(+21.7)#35 | 11.1%(+23.3)#3,170 |
| 36. | 48614 | 34.1% | 12.7%(+21.5)#36 | 11.1%(+23.1)#3,241 |
| 37. | 48647 | 33.8% | 12.7%(+21.2)#37 | 11.1%(+22.8)#3,312 |
| 38. | 49791 | 33.3% | 12.7%(+20.7)#38 | 11.1%(+22.3)#3,477 |
| 39. | 49228 | 32.9% | 12.7%(+20.3)#39 | 11.1%(+21.9)#3,577 |
| 40. | 48765 | 32.8% | 12.7%(+20.2)#40 | 11.1%(+21.8)#3,600 |
| 41. | 48737 | 32.7% | 12.7%(+20.1)#41 | 11.1%(+21.7)#3,624 |
| 42. | 48728 | 32.7% | 12.7%(+20.0)#42 | 11.1%(+21.6)#3,637 |
| 43. | 49262 | 32.5% | 12.7%(+19.8)#43 | 11.1%(+21.4)#3,683 |
| 44. | 49625 | 32.3% | 12.7%(+19.7)#44 | 11.1%(+21.3)#3,733 |
| 45. | 49947 | 32.3% | 12.7%(+19.6)#45 | 11.1%(+21.2)#3,752 |
| 46. | 49799 | 32.2% | 12.7%(+19.6)#46 | 11.1%(+21.2)#3,758 |
| 47. | 49032 | 32.1% | 12.7%(+19.5)#47 | 11.1%(+21.1)#3,797 |
| 48. | 49446 | 32.1% | 12.7%(+19.4)#48 | 11.1%(+21.0)#3,805 |
| 49. | 49879 | 32.0% | 12.7%(+19.3)#49 | 11.1%(+20.9)#3,851 |
| 50. | 49872 | 31.2% | 12.7%(+18.6)#50 | 11.1%(+20.2)#4,053 |
| 51. | 49052 | 30.6% | 12.7%(+18.0)#51 | 11.1%(+19.6)#4,246 |
| 52. | 49827 | 30.5% | 12.7%(+17.9)#52 | 11.1%(+19.5)#4,285 |
| 53. | 49266 | 30.3% | 12.7%(+17.6)#53 | 11.1%(+19.2)#4,378 |
| 54. | 49881 | 29.6% | 12.7%(+16.9)#54 | 11.1%(+18.5)#4,639 |
| 55. | 49812 | 29.5% | 12.7%(+16.9)#55 | 11.1%(+18.5)#4,662 |
| 56. | 48625 | 29.5% | 12.7%(+16.8)#56 | 11.1%(+18.4)#4,674 |
| 57. | 49087 | 29.5% | 12.7%(+16.8)#57 | 11.1%(+18.4)#4,678 |
| 58. | 48705 | 29.4% | 12.7%(+16.8)#58 | 11.1%(+18.4)#4,703 |
| 59. | 49655 | 29.3% | 12.7%(+16.7)#59 | 11.1%(+18.3)#4,735 |
| 60. | 49780 | 29.1% | 12.7%(+16.4)#60 | 11.1%(+18.0)#4,839 |
| 61. | 48841 | 29.1% | 12.7%(+16.4)#61 | 11.1%(+18.0)#4,844 |
| 62. | 49410 | 29.0% | 12.7%(+16.4)#62 | 11.1%(+18.0)#4,875 |
| 63. | 49689 | 28.8% | 12.7%(+16.1)#63 | 11.1%(+17.7)#4,964 |
| 64. | 49746 | 28.8% | 12.7%(+16.1)#64 | 11.1%(+17.7)#4,970 |
| 65. | 48871 | 28.7% | 12.7%(+16.0)#65 | 11.1%(+17.6)#5,016 |
| 66. | 48133 | 28.6% | 12.7%(+15.9)#66 | 11.1%(+17.5)#5,033 |
| 67. | 49910 | 28.6% | 12.7%(+15.9)#67 | 11.1%(+17.5)#5,072 |
| 68. | 49031 | 28.5% | 12.7%(+15.9)#68 | 11.1%(+17.5)#5,096 |
| 69. | 48635 | 28.5% | 12.7%(+15.8)#69 | 11.1%(+17.4)#5,123 |
| 70. | 48742 | 28.4% | 12.7%(+15.7)#70 | 11.1%(+17.3)#5,161 |
| 71. | 48748 | 28.4% | 12.7%(+15.7)#71 | 11.1%(+17.3)#5,178 |
| 72. | 48811 | 28.3% | 12.7%(+15.6)#72 | 11.1%(+17.2)#5,218 |
| 73. | 49886 | 28.0% | 12.7%(+15.3)#73 | 11.1%(+16.9)#5,318 |
| 74. | 48884 | 28.0% | 12.7%(+15.3)#74 | 11.1%(+16.9)#5,334 |
| 75. | 48005 | 28.0% | 12.7%(+15.3)#75 | 11.1%(+16.9)#5,338 |
| 76. | 49918 | 27.9% | 12.7%(+15.2)#76 | 11.1%(+16.8)#5,363 |
| 77. | 48617 | 27.9% | 12.7%(+15.2)#77 | 11.1%(+16.8)#5,366 |
| 78. | 49776 | 27.8% | 12.7%(+15.2)#78 | 11.1%(+16.8)#5,392 |
| 79. | 49332 | 27.7% | 12.7%(+15.1)#79 | 11.1%(+16.7)#5,432 |
| 80. | 48730 | 27.6% | 12.7%(+14.9)#80 | 11.1%(+16.5)#5,524 |
| 81. | 49033 | 27.6% | 12.7%(+14.9)#81 | 11.1%(+16.5)#5,525 |
| 82. | 49329 | 27.5% | 12.7%(+14.9)#82 | 11.1%(+16.5)#5,536 |
| 83. | 48416 | 27.5% | 12.7%(+14.8)#83 | 11.1%(+16.4)#5,555 |
| 84. | 49896 | 27.3% | 12.7%(+14.7)#84 | 11.1%(+16.3)#5,631 |
| 85. | 49072 | 27.1% | 12.7%(+14.5)#85 | 11.1%(+16.1)#5,719 |
| 86. | 49817 | 27.1% | 12.7%(+14.4)#86 | 11.1%(+16.0)#5,758 |
| 87. | 48703 | 27.0% | 12.7%(+14.3)#87 | 11.1%(+15.9)#5,795 |
| 88. | 49709 | 26.9% | 12.7%(+14.2)#88 | 11.1%(+15.8)#5,841 |
| 89. | 49719 | 26.8% | 12.7%(+14.2)#89 | 11.1%(+15.8)#5,877 |
| 90. | 48725 | 26.8% | 12.7%(+14.2)#90 | 11.1%(+15.7)#5,882 |
| 91. | 49639 | 26.8% | 12.7%(+14.1)#91 | 11.1%(+15.7)#5,889 |
| 92. | 49657 | 26.7% | 12.7%(+14.0)#92 | 11.1%(+15.6)#5,941 |
| 93. | 49762 | 26.7% | 12.7%(+14.0)#93 | 11.1%(+15.6)#5,953 |
| 94. | 49826 | 26.7% | 12.7%(+14.0)#94 | 11.1%(+15.6)#5,962 |
| 95. | 49729 | 26.6% | 12.7%(+14.0)#95 | 11.1%(+15.6)#5,980 |
| 96. | 49091 | 26.6% | 12.7%(+13.9)#96 | 11.1%(+15.5)#6,013 |
| 97. | 49759 | 26.4% | 12.7%(+13.7)#97 | 11.1%(+15.3)#6,100 |
| 98. | 48750 | 26.4% | 12.7%(+13.7)#98 | 11.1%(+15.3)#6,104 |
| 99. | 49421 | 26.4% | 12.7%(+13.7)#99 | 11.1%(+15.3)#6,109 |
| 100. | 49026 | 26.3% | 12.7%(+13.6)#100 | 11.1%(+15.2)#6,155 |
Common Questions
What are the Top 10 Zip Codes with the Highest Percentage of Population with a Degree in Education in Michigan?
Top 10 Zip Codes with the Highest Percentage of Population with a Degree in Education in Michigan are:
What zip code has the Highest Percentage of Population with a Degree in Education in Michigan?
49634 has the Highest Percentage of Population with a Degree in Education in Michigan with 100.0%.
What is the Percentage of Population with a Degree in Education in the State of Michigan?
Percentage of Population with a Degree in Education in Michigan is 12.7%.
What is the Percentage of Population with a Degree in Education in the United States?
Percentage of Population with a Degree in Education in the United States is 11.1%.