Zip Codes with the Highest Percentage of Households with Income Above $100,000 in Plainfield, IL
RELATED REPORTS & OPTIONS
Household Income | $100k+
Plainfield
Compare Zip Codes
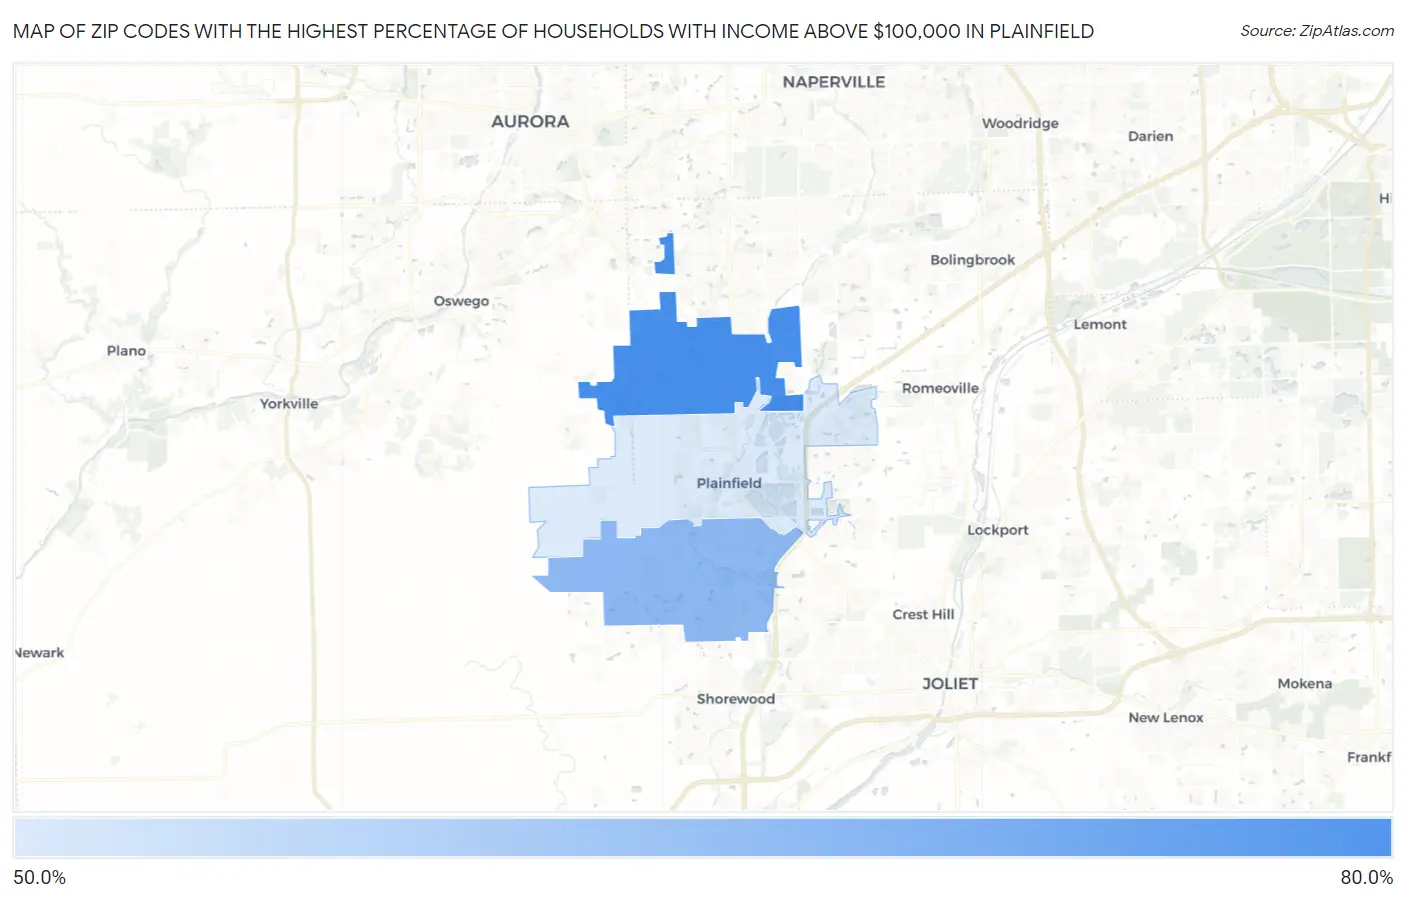
Map of Zip Codes with the Highest Percentage of Households with Income Above $100,000 in Plainfield
0.0%
80.0%
Zip Codes with the Highest Percentage of Households with Income Above $100,000 in Plainfield, IL
| Zip Code | Households with Income > $100k | vs State | vs National | |
| 1. | 60585 | 73.0% | 39.1%(+33.9)#19 | 37.3%(+35.7)#700 |
| 2. | 60586 | 62.8% | 39.1%(+23.7)#64 | 37.3%(+25.5)#1,879 |
| 3. | 60544 | 51.5% | 39.1%(+12.4)#184 | 37.3%(+14.2)#4,397 |
1
Common Questions
What are the Top Zip Codes with the Highest Percentage of Households with Income Above $100,000 in Plainfield, IL?
Top Zip Codes with the Highest Percentage of Households with Income Above $100,000 in Plainfield, IL are:
What zip code has the Highest Percentage of Households with Income Above $100,000 in Plainfield, IL?
60585 has the Highest Percentage of Households with Income Above $100,000 in Plainfield, IL with 73.0%.
What is the Percentage of Households with Income Above $100,000 in Plainfield, IL?
Percentage of Households with Income Above $100,000 in Plainfield is 69.4%.
What is the Percentage of Households with Income Above $100,000 in Illinois?
Percentage of Households with Income Above $100,000 in Illinois is 39.1%.
What is the Percentage of Households with Income Above $100,000 in the United States?
Percentage of Households with Income Above $100,000 in the United States is 37.3%.