Zip Codes with the Highest Percentage of Households with Income Above $200,000 in Bloomington, IL
RELATED REPORTS & OPTIONS
Household Income | $200k+
Bloomington
Compare Zip Codes
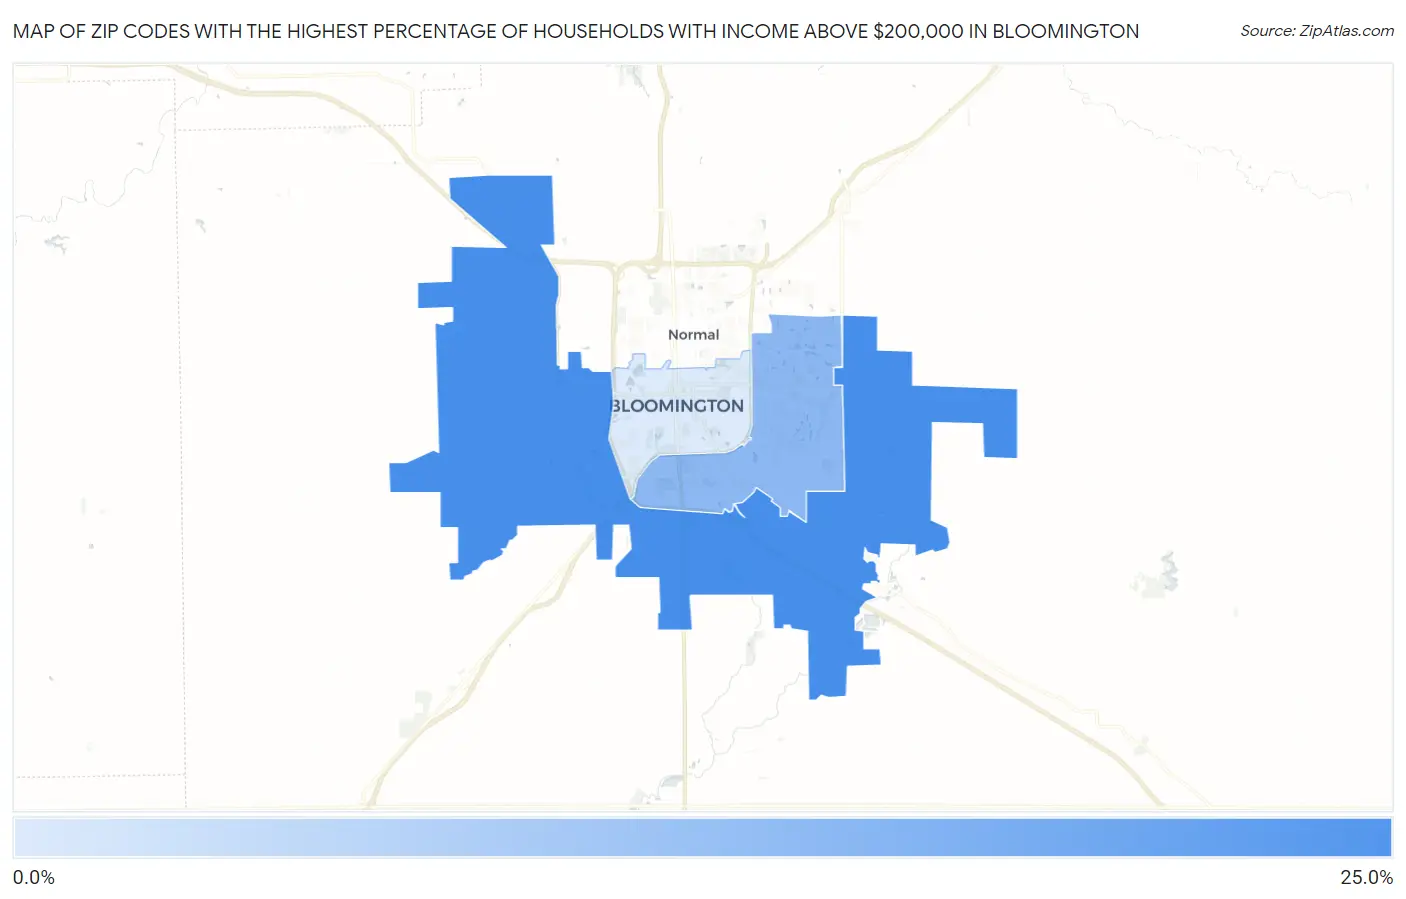
Map of Zip Codes with the Highest Percentage of Households with Income Above $200,000 in Bloomington
0.0%
25.0%
Zip Codes with the Highest Percentage of Households with Income Above $200,000 in Bloomington, IL
| Zip Code | Households with Income > $200k | vs State | vs National | |
| 1. | 61705 | 23.6% | 12.1%(+11.5)#83 | 11.4%(+12.2)#2,447 |
| 2. | 61704 | 13.8% | 12.1%(+1.70)#214 | 11.4%(+2.40)#5,563 |
| 3. | 61701 | 3.3% | 12.1%(-8.80)#865 | 11.4%(-8.10)#20,007 |
1
Common Questions
What are the Top Zip Codes with the Highest Percentage of Households with Income Above $200,000 in Bloomington, IL?
Top Zip Codes with the Highest Percentage of Households with Income Above $200,000 in Bloomington, IL are:
What zip code has the Highest Percentage of Households with Income Above $200,000 in Bloomington, IL?
61705 has the Highest Percentage of Households with Income Above $200,000 in Bloomington, IL with 23.6%.
What is the Percentage of Households with Income Above $200,000 in Bloomington, IL?
Percentage of Households with Income Above $200,000 in Bloomington is 9.5%.
What is the Percentage of Households with Income Above $200,000 in Illinois?
Percentage of Households with Income Above $200,000 in Illinois is 12.1%.
What is the Percentage of Households with Income Above $200,000 in the United States?
Percentage of Households with Income Above $200,000 in the United States is 11.4%.