Zip Codes with the Highest Percentage of Population with a Degree in Visual and Performing Arts in Buford, GA
RELATED REPORTS & OPTIONS
Visual and Performing Arts
Buford
Compare Zip Codes
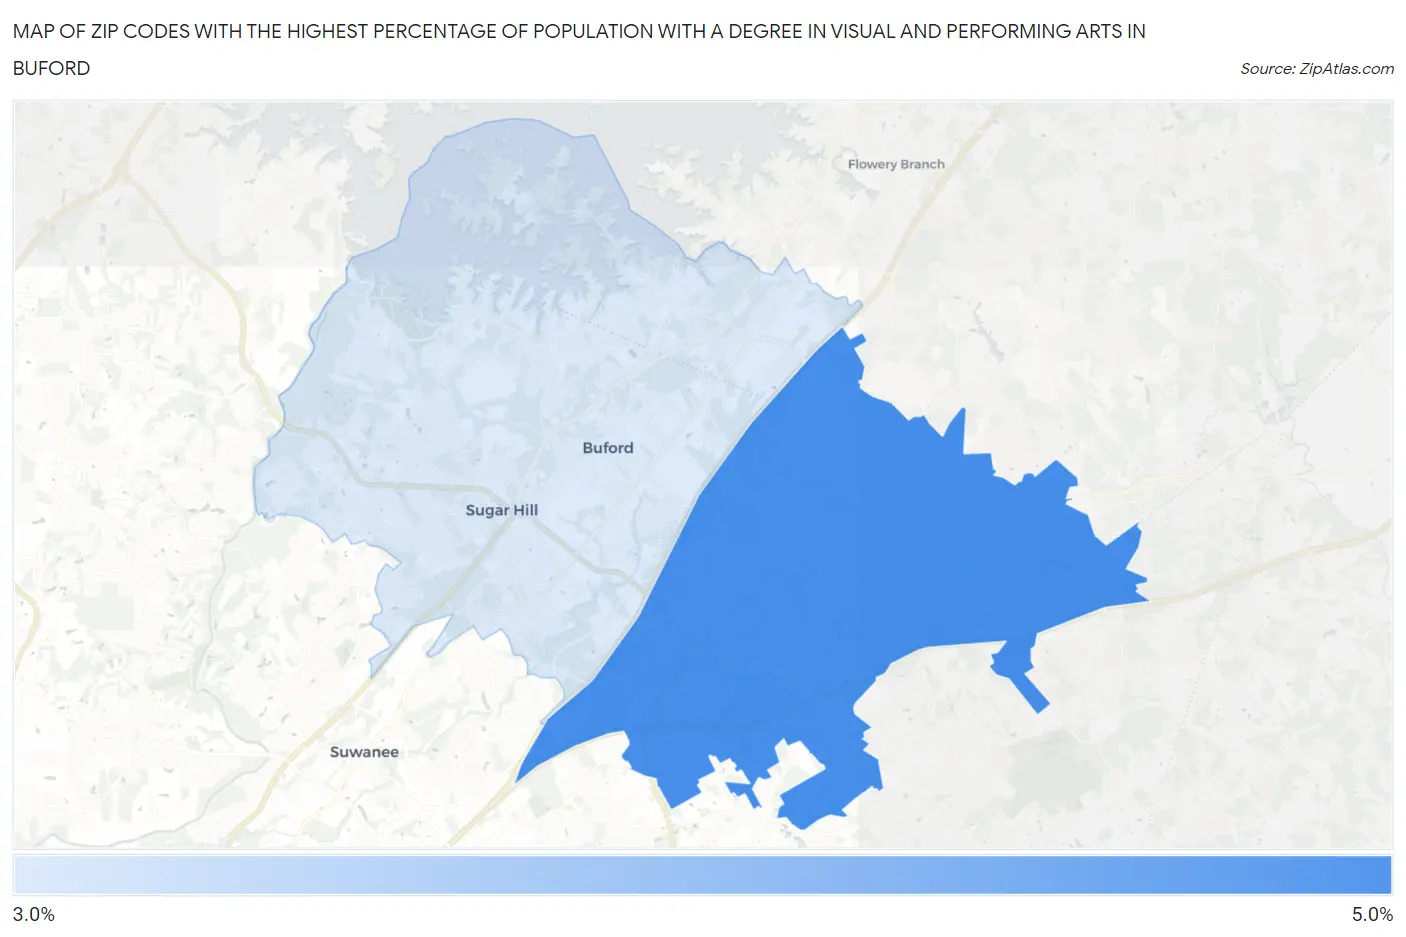
Map of Zip Codes with the Highest Percentage of Population with a Degree in Visual and Performing Arts in Buford
0.0%
5.0%
Zip Codes with the Highest Percentage of Population with a Degree in Visual and Performing Arts in Buford, GA
| Zip Code | % Graduates | vs State | vs National | |
| 1. | 30519 | 4.6% | 3.8%(+0.814)#146 | 4.3%(+0.353)#7,542 |
| 2. | 30518 | 3.7% | 3.8%(-0.048)#206 | 4.3%(-0.509)#10,020 |
1
Common Questions
What are the Top Zip Codes with the Highest Percentage of Population with a Degree in Visual and Performing Arts in Buford, GA?
Top Zip Codes with the Highest Percentage of Population with a Degree in Visual and Performing Arts in Buford, GA are:
What zip code has the Highest Percentage of Population with a Degree in Visual and Performing Arts in Buford, GA?
30519 has the Highest Percentage of Population with a Degree in Visual and Performing Arts in Buford, GA with 4.6%.
What is the Percentage of Population with a Degree in Visual and Performing Arts in Buford, GA?
Percentage of Population with a Degree in Visual and Performing Arts in Buford is 4.0%.
What is the Percentage of Population with a Degree in Visual and Performing Arts in Georgia?
Percentage of Population with a Degree in Visual and Performing Arts in Georgia is 3.8%.
What is the Percentage of Population with a Degree in Visual and Performing Arts in the United States?
Percentage of Population with a Degree in Visual and Performing Arts in the United States is 4.3%.