Zip Codes with the Highest Percentage of Population with a Degree in Visual and Performing Arts in Alpharetta, GA
RELATED REPORTS & OPTIONS
Visual and Performing Arts
Alpharetta
Compare Zip Codes
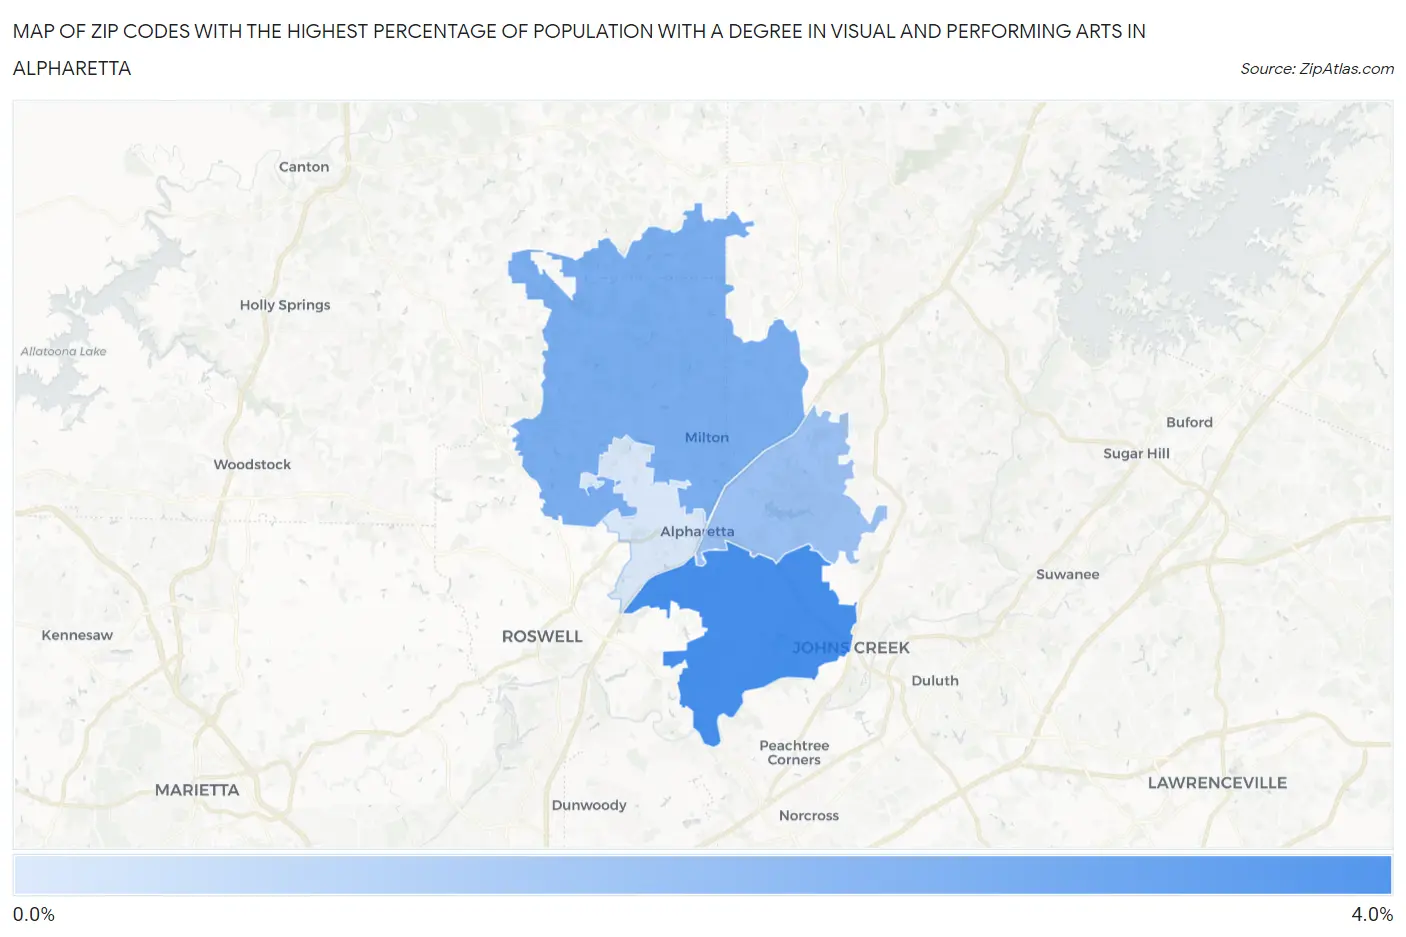
Map of Zip Codes with the Highest Percentage of Population with a Degree in Visual and Performing Arts in Alpharetta
0.0%
4.0%
Zip Codes with the Highest Percentage of Population with a Degree in Visual and Performing Arts in Alpharetta, GA
| Zip Code | % Graduates | vs State | vs National | |
| 1. | 30022 | 3.2% | 3.8%(-0.602)#253 | 4.3%(-1.06)#12,031 |
| 2. | 30004 | 2.4% | 3.8%(-1.39)#324 | 4.3%(-1.86)#15,013 |
| 3. | 30005 | 2.0% | 3.8%(-1.84)#362 | 4.3%(-2.30)#16,609 |
| 4. | 30009 | 0.99% | 3.8%(-2.80)#441 | 4.3%(-3.26)#19,693 |
1
Common Questions
What are the Top 3 Zip Codes with the Highest Percentage of Population with a Degree in Visual and Performing Arts in Alpharetta, GA?
Top 3 Zip Codes with the Highest Percentage of Population with a Degree in Visual and Performing Arts in Alpharetta, GA are:
What zip code has the Highest Percentage of Population with a Degree in Visual and Performing Arts in Alpharetta, GA?
30022 has the Highest Percentage of Population with a Degree in Visual and Performing Arts in Alpharetta, GA with 3.2%.
What is the Percentage of Population with a Degree in Visual and Performing Arts in Alpharetta, GA?
Percentage of Population with a Degree in Visual and Performing Arts in Alpharetta is 1.8%.
What is the Percentage of Population with a Degree in Visual and Performing Arts in Georgia?
Percentage of Population with a Degree in Visual and Performing Arts in Georgia is 3.8%.
What is the Percentage of Population with a Degree in Visual and Performing Arts in the United States?
Percentage of Population with a Degree in Visual and Performing Arts in the United States is 4.3%.