Zip Codes with the Highest Percentage of Population Employed in Architecture & Engineering in Clermont, FL
RELATED REPORTS & OPTIONS
Architecture & Engineering
Clermont
Compare Zip Codes
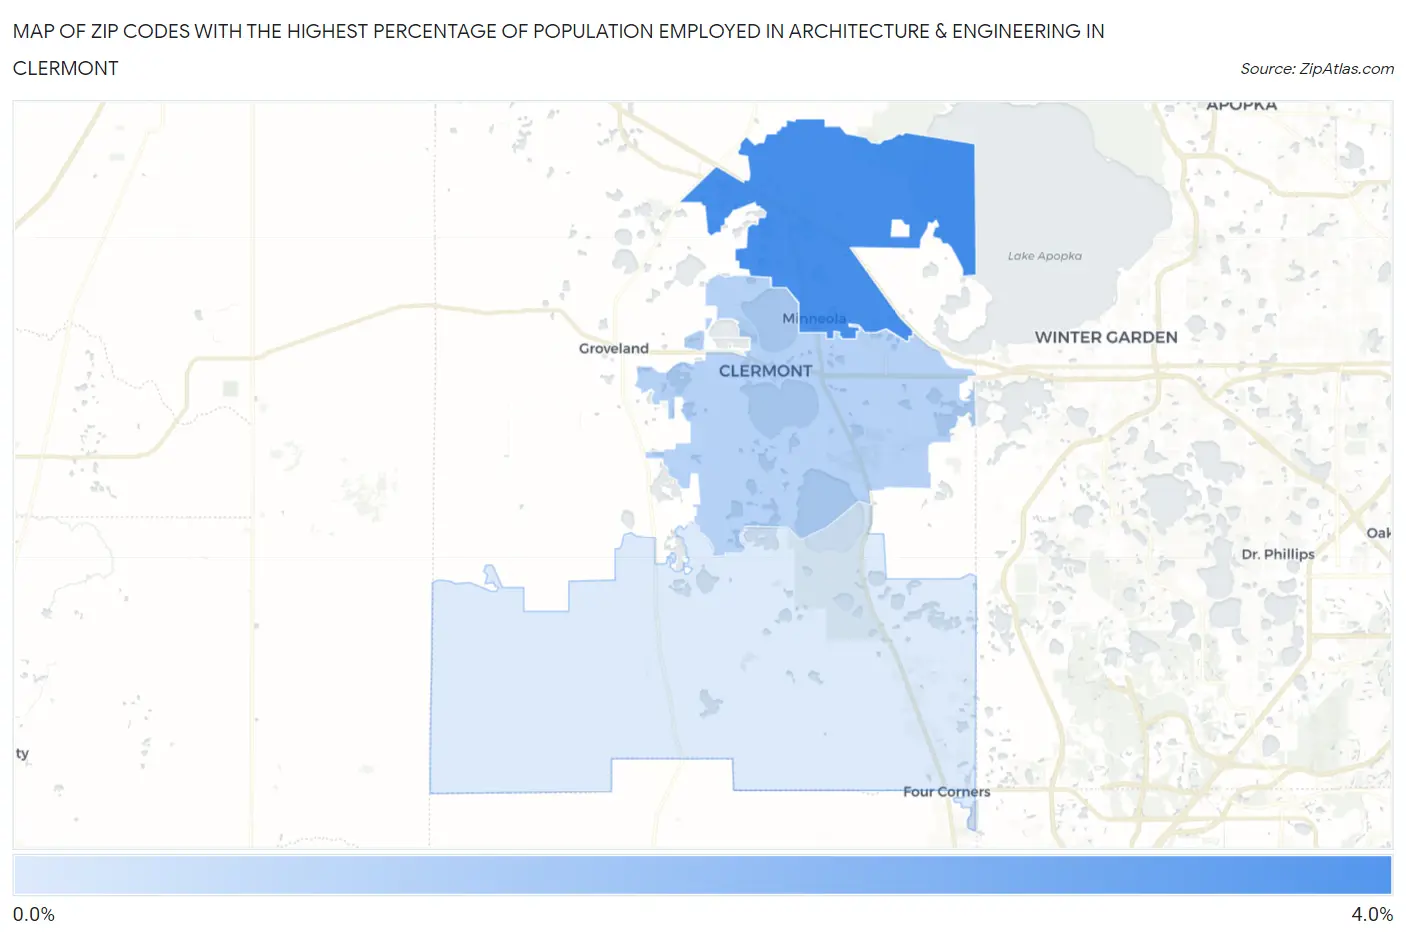
Map of Zip Codes with the Highest Percentage of Population Employed in Architecture & Engineering in Clermont
0.0%
4.0%
Zip Codes with the Highest Percentage of Population Employed in Architecture & Engineering in Clermont, FL
| Zip Code | % Employed | vs State | vs National | |
| 1. | 34715 | 3.7% | 1.6%(+2.08)#65 | 2.1%(+1.53)#3,350 |
| 2. | 34711 | 1.2% | 1.6%(-0.355)#473 | 2.1%(-0.905)#14,730 |
| 3. | 34714 | 0.38% | 1.6%(-1.22)#789 | 2.1%(-1.77)#21,098 |
1
Common Questions
What are the Top Zip Codes with the Highest Percentage of Population Employed in Architecture & Engineering in Clermont, FL?
Top Zip Codes with the Highest Percentage of Population Employed in Architecture & Engineering in Clermont, FL are:
What zip code has the Highest Percentage of Population Employed in Architecture & Engineering in Clermont, FL?
34715 has the Highest Percentage of Population Employed in Architecture & Engineering in Clermont, FL with 3.7%.
What is the Percentage of Population Employed in Architecture & Engineering in Clermont, FL?
Percentage of Population Employed in Architecture & Engineering in Clermont is 1.2%.
What is the Percentage of Population Employed in Architecture & Engineering in Florida?
Percentage of Population Employed in Architecture & Engineering in Florida is 1.6%.
What is the Percentage of Population Employed in Architecture & Engineering in the United States?
Percentage of Population Employed in Architecture & Engineering in the United States is 2.1%.