Zip Codes with the Highest Percentage of Population Employed in Architecture & Engineering in Tarpon Springs, FL
RELATED REPORTS & OPTIONS
Architecture & Engineering
Tarpon Springs
Compare Zip Codes
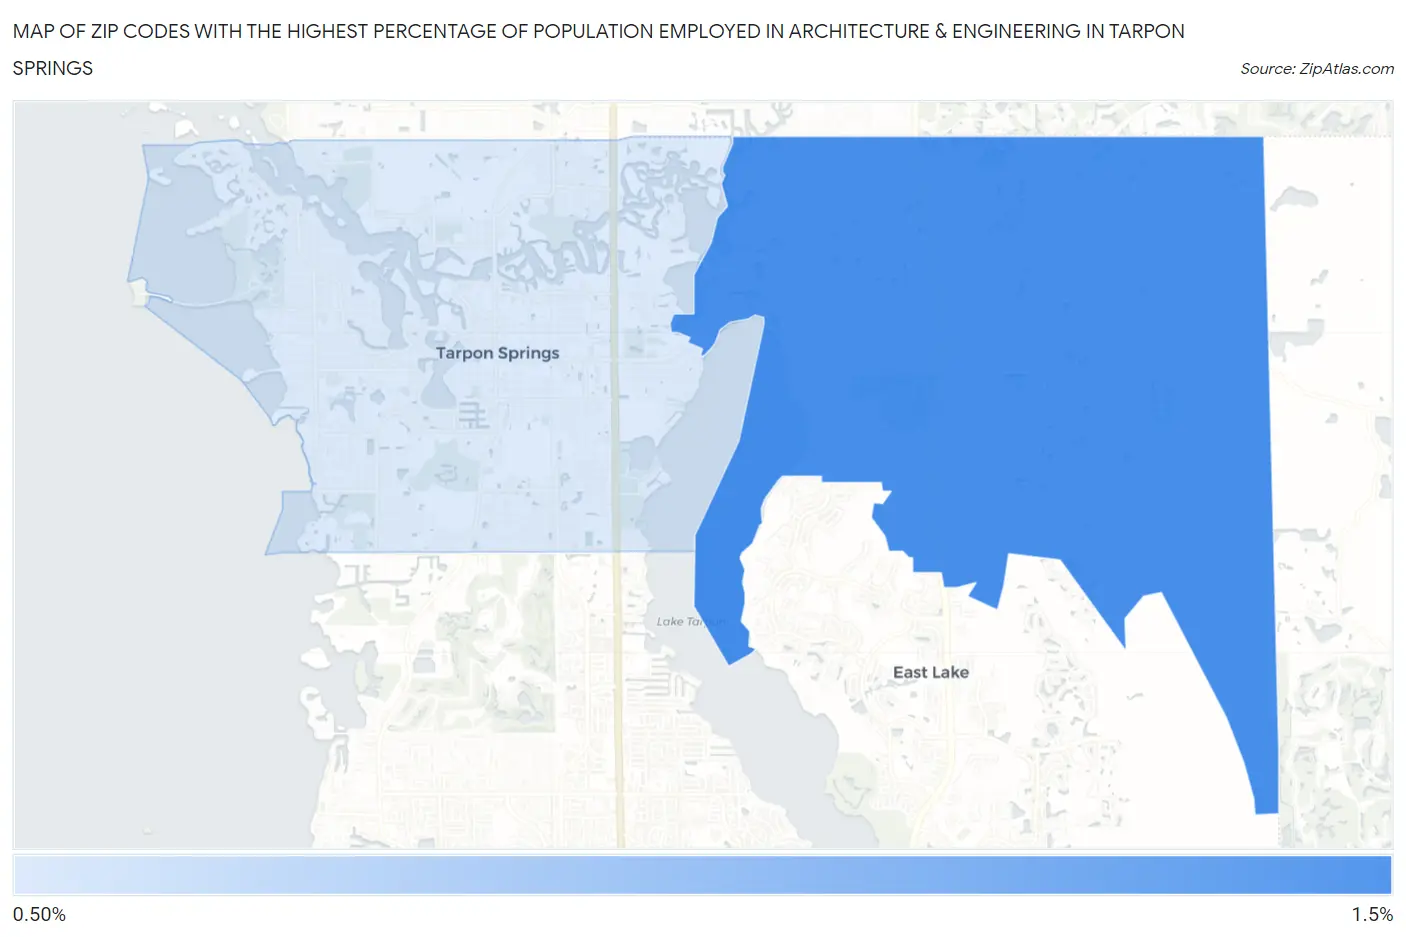
Map of Zip Codes with the Highest Percentage of Population Employed in Architecture & Engineering in Tarpon Springs
0.0%
1.5%
Zip Codes with the Highest Percentage of Population Employed in Architecture & Engineering in Tarpon Springs, FL
| Zip Code | % Employed | vs State | vs National | |
| 1. | 34688 | 1.4% | 1.6%(-0.212)#431 | 2.1%(-0.762)#13,682 |
| 2. | 34689 | 1.1% | 1.6%(-0.505)#547 | 2.1%(-1.06)#15,899 |
1
Common Questions
What are the Top Zip Codes with the Highest Percentage of Population Employed in Architecture & Engineering in Tarpon Springs, FL?
Top Zip Codes with the Highest Percentage of Population Employed in Architecture & Engineering in Tarpon Springs, FL are:
What zip code has the Highest Percentage of Population Employed in Architecture & Engineering in Tarpon Springs, FL?
34688 has the Highest Percentage of Population Employed in Architecture & Engineering in Tarpon Springs, FL with 1.4%.
What is the Percentage of Population Employed in Architecture & Engineering in Tarpon Springs, FL?
Percentage of Population Employed in Architecture & Engineering in Tarpon Springs is 1.2%.
What is the Percentage of Population Employed in Architecture & Engineering in Florida?
Percentage of Population Employed in Architecture & Engineering in Florida is 1.6%.
What is the Percentage of Population Employed in Architecture & Engineering in the United States?
Percentage of Population Employed in Architecture & Engineering in the United States is 2.1%.