Zip Codes with the Highest Percentage of Population Employed in Architecture & Engineering in Englewood, FL
RELATED REPORTS & OPTIONS
Architecture & Engineering
Englewood
Compare Zip Codes
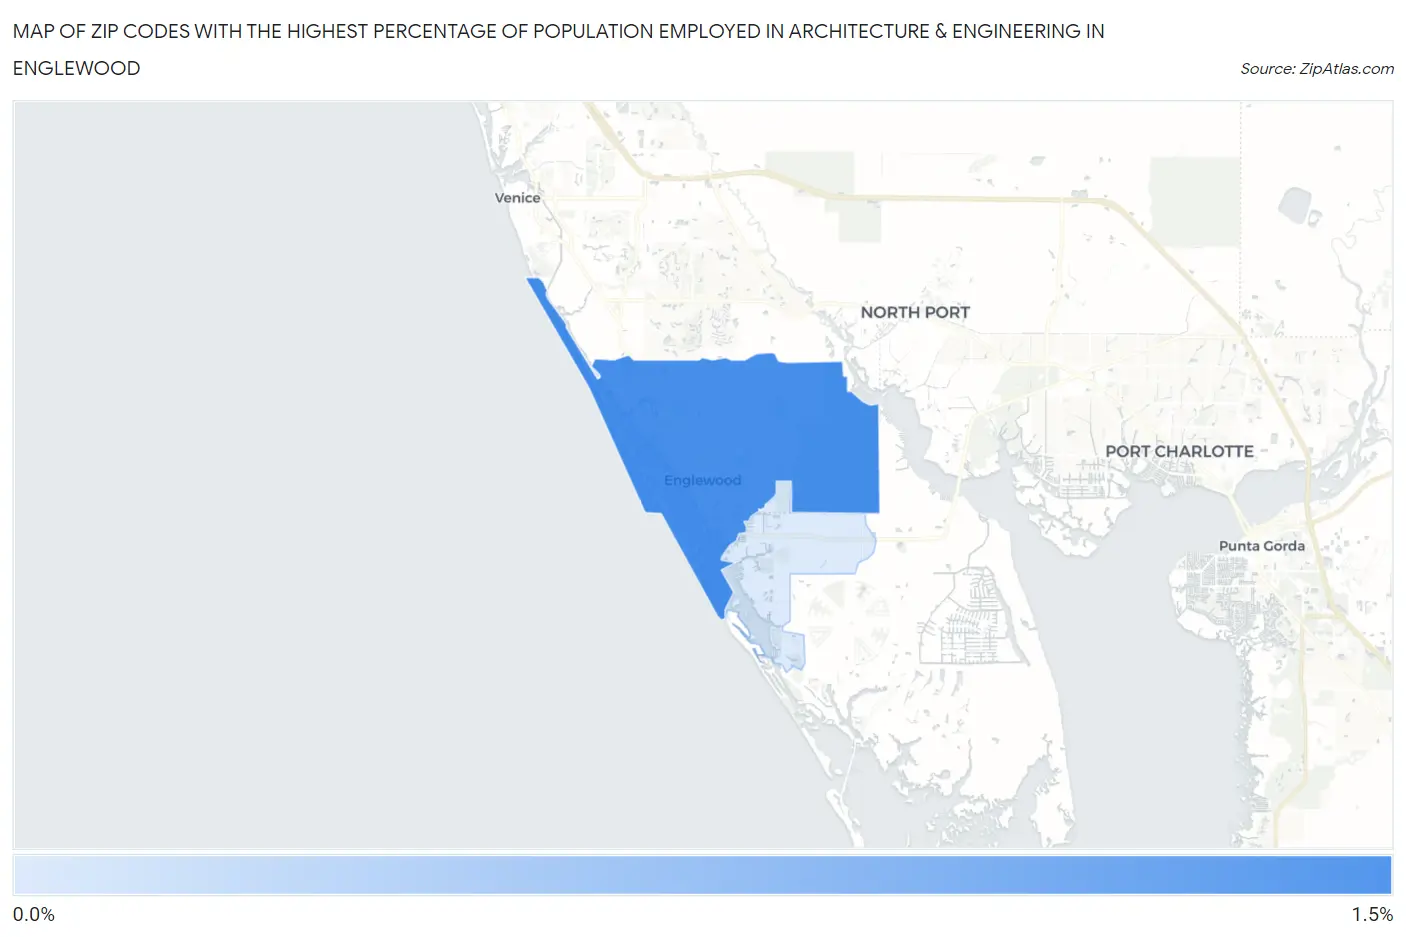
Map of Zip Codes with the Highest Percentage of Population Employed in Architecture & Engineering in Englewood
0.0%
1.5%
Zip Codes with the Highest Percentage of Population Employed in Architecture & Engineering in Englewood, FL
| Zip Code | % Employed | vs State | vs National | |
| 1. | 34223 | 1.2% | 1.6%(-0.363)#477 | 2.1%(-0.913)#14,791 |
| 2. | 34224 | 0.43% | 1.6%(-1.17)#771 | 2.1%(-1.72)#20,721 |
1
Common Questions
What are the Top Zip Codes with the Highest Percentage of Population Employed in Architecture & Engineering in Englewood, FL?
Top Zip Codes with the Highest Percentage of Population Employed in Architecture & Engineering in Englewood, FL are:
What zip code has the Highest Percentage of Population Employed in Architecture & Engineering in Englewood, FL?
34223 has the Highest Percentage of Population Employed in Architecture & Engineering in Englewood, FL with 1.2%.
What is the Percentage of Population Employed in Architecture & Engineering in Englewood, FL?
Percentage of Population Employed in Architecture & Engineering in Englewood is 1.5%.
What is the Percentage of Population Employed in Architecture & Engineering in Florida?
Percentage of Population Employed in Architecture & Engineering in Florida is 1.6%.
What is the Percentage of Population Employed in Architecture & Engineering in the United States?
Percentage of Population Employed in Architecture & Engineering in the United States is 2.1%.