Native/Alaskan vs Venezuelan Births to Unmarried Women
COMPARE
Native/Alaskan
Venezuelan
Births to Unmarried Women
Births to Unmarried Women Comparison
Natives/Alaskans
Venezuelans
43.0%
BIRTHS TO UNMARRIED WOMEN
0.0/ 100
METRIC RATING
331st/ 347
METRIC RANK
31.7%
BIRTHS TO UNMARRIED WOMEN
50.0/ 100
METRIC RATING
174th/ 347
METRIC RANK
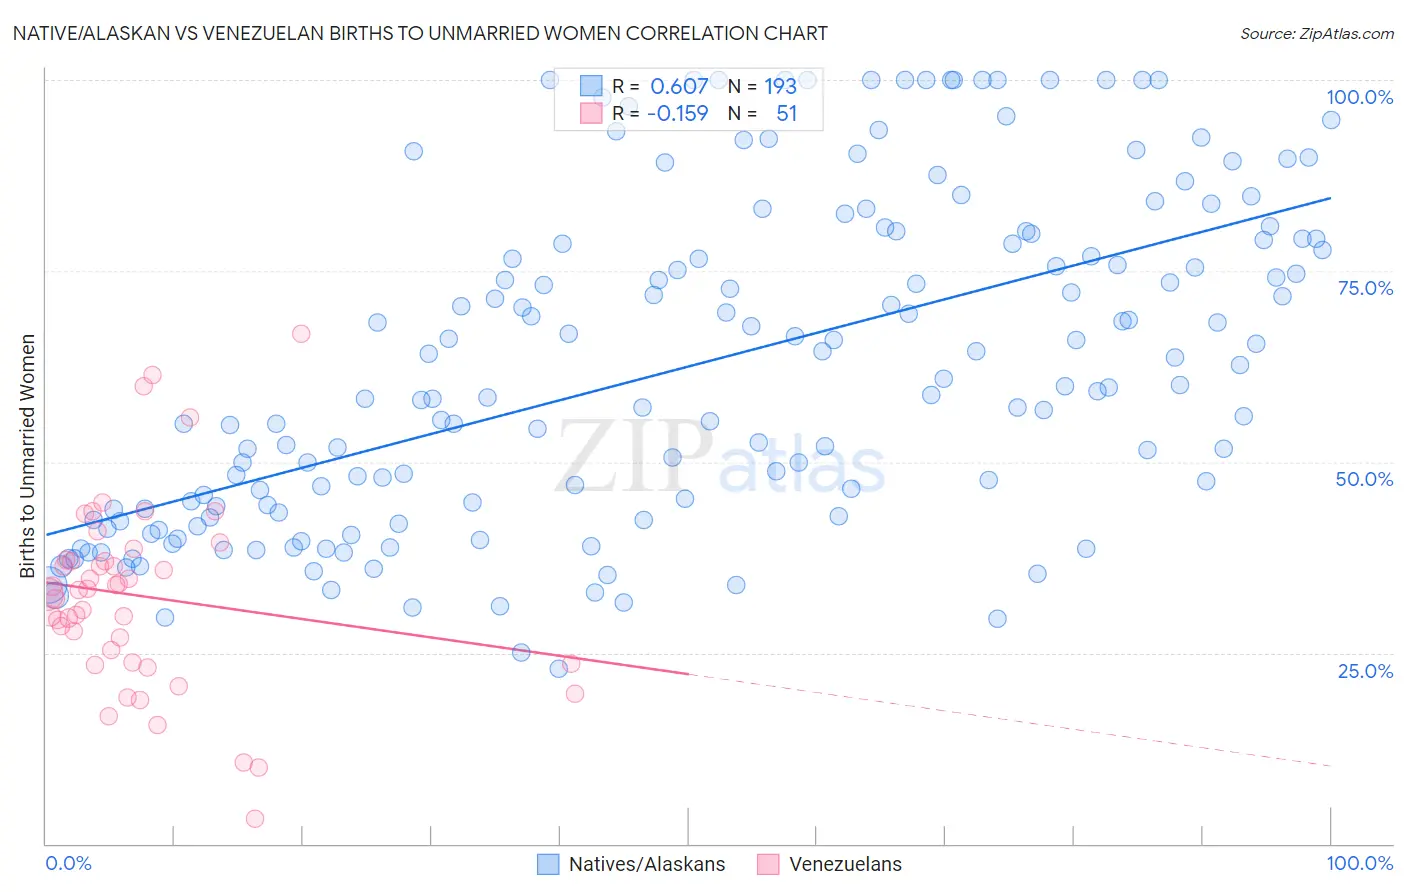
Native/Alaskan vs Venezuelan Births to Unmarried Women Correlation Chart
The statistical analysis conducted on geographies consisting of 471,404,476 people shows a significant positive correlation between the proportion of Natives/Alaskans and percentage of births to unmarried women in the United States with a correlation coefficient (R) of 0.607 and weighted average of 43.0%. Similarly, the statistical analysis conducted on geographies consisting of 290,839,200 people shows a poor negative correlation between the proportion of Venezuelans and percentage of births to unmarried women in the United States with a correlation coefficient (R) of -0.159 and weighted average of 31.7%, a difference of 35.7%.
Births to Unmarried Women Correlation Summary
| Measurement | Native/Alaskan | Venezuelan |
| Minimum | 22.9% | 3.3% |
| Maximum | 100.0% | 66.7% |
| Range | 77.1% | 63.4% |
| Mean | 62.5% | 32.5% |
| Median | 59.8% | 33.2% |
| Interquartile 25% (IQ1) | 43.2% | 23.7% |
| Interquartile 75% (IQ3) | 79.1% | 37.2% |
| Interquartile Range (IQR) | 35.9% | 13.4% |
| Standard Deviation (Sample) | 21.3% | 12.5% |
| Standard Deviation (Population) | 21.3% | 12.3% |
Similar Demographics by Births to Unmarried Women
Demographics Similar to Natives/Alaskans by Births to Unmarried Women
In terms of births to unmarried women, the demographic groups most similar to Natives/Alaskans are Kiowa (43.1%, a difference of 0.35%), Chippewa (42.6%, a difference of 0.83%), Paiute (42.5%, a difference of 1.2%), Immigrants from Cabo Verde (42.2%, a difference of 1.8%), and Tsimshian (42.2%, a difference of 2.0%).
| Demographics | Rating | Rank | Births to Unmarried Women |
| Cape Verdeans | 0.0 /100 | #324 | Tragic 41.3% |
| Cheyenne | 0.0 /100 | #325 | Tragic 41.3% |
| Immigrants | Cuba | 0.0 /100 | #326 | Tragic 41.5% |
| Tsimshian | 0.0 /100 | #327 | Tragic 42.2% |
| Immigrants | Cabo Verde | 0.0 /100 | #328 | Tragic 42.2% |
| Paiute | 0.0 /100 | #329 | Tragic 42.5% |
| Chippewa | 0.0 /100 | #330 | Tragic 42.6% |
| Natives/Alaskans | 0.0 /100 | #331 | Tragic 43.0% |
| Kiowa | 0.0 /100 | #332 | Tragic 43.1% |
| Blacks/African Americans | 0.0 /100 | #333 | Tragic 44.3% |
| Yuman | 0.0 /100 | #334 | Tragic 44.4% |
| Colville | 0.0 /100 | #335 | Tragic 45.3% |
| Puerto Ricans | 0.0 /100 | #336 | Tragic 45.7% |
| Houma | 0.0 /100 | #337 | Tragic 46.6% |
| Arapaho | 0.0 /100 | #338 | Tragic 47.1% |
Demographics Similar to Venezuelans by Births to Unmarried Women
In terms of births to unmarried women, the demographic groups most similar to Venezuelans are Immigrants from Yemen (31.7%, a difference of 0.020%), Immigrants from Eritrea (31.7%, a difference of 0.040%), Finnish (31.7%, a difference of 0.050%), Immigrants from Venezuela (31.7%, a difference of 0.080%), and Guamanian/Chamorro (31.6%, a difference of 0.13%).
| Demographics | Rating | Rank | Births to Unmarried Women |
| Dutch | 55.3 /100 | #167 | Average 31.5% |
| Belgians | 52.4 /100 | #168 | Average 31.6% |
| Slavs | 52.0 /100 | #169 | Average 31.6% |
| Guamanians/Chamorros | 51.3 /100 | #170 | Average 31.6% |
| Finns | 50.5 /100 | #171 | Average 31.7% |
| Immigrants | Eritrea | 50.4 /100 | #172 | Average 31.7% |
| Immigrants | Yemen | 50.2 /100 | #173 | Average 31.7% |
| Venezuelans | 50.0 /100 | #174 | Average 31.7% |
| Immigrants | Venezuela | 49.2 /100 | #175 | Average 31.7% |
| Scottish | 48.1 /100 | #176 | Average 31.7% |
| South American Indians | 47.7 /100 | #177 | Average 31.7% |
| English | 47.4 /100 | #178 | Average 31.7% |
| South Americans | 46.9 /100 | #179 | Average 31.8% |
| Moroccans | 45.7 /100 | #180 | Average 31.8% |
| Immigrants | Peru | 45.1 /100 | #181 | Average 31.8% |