Bolivian vs Venezuelan Births to Unmarried Women
COMPARE
Bolivian
Venezuelan
Births to Unmarried Women
Births to Unmarried Women Comparison
Bolivians
Venezuelans
28.5%
BIRTHS TO UNMARRIED WOMEN
98.7/ 100
METRIC RATING
69th/ 347
METRIC RANK
31.7%
BIRTHS TO UNMARRIED WOMEN
50.0/ 100
METRIC RATING
174th/ 347
METRIC RANK
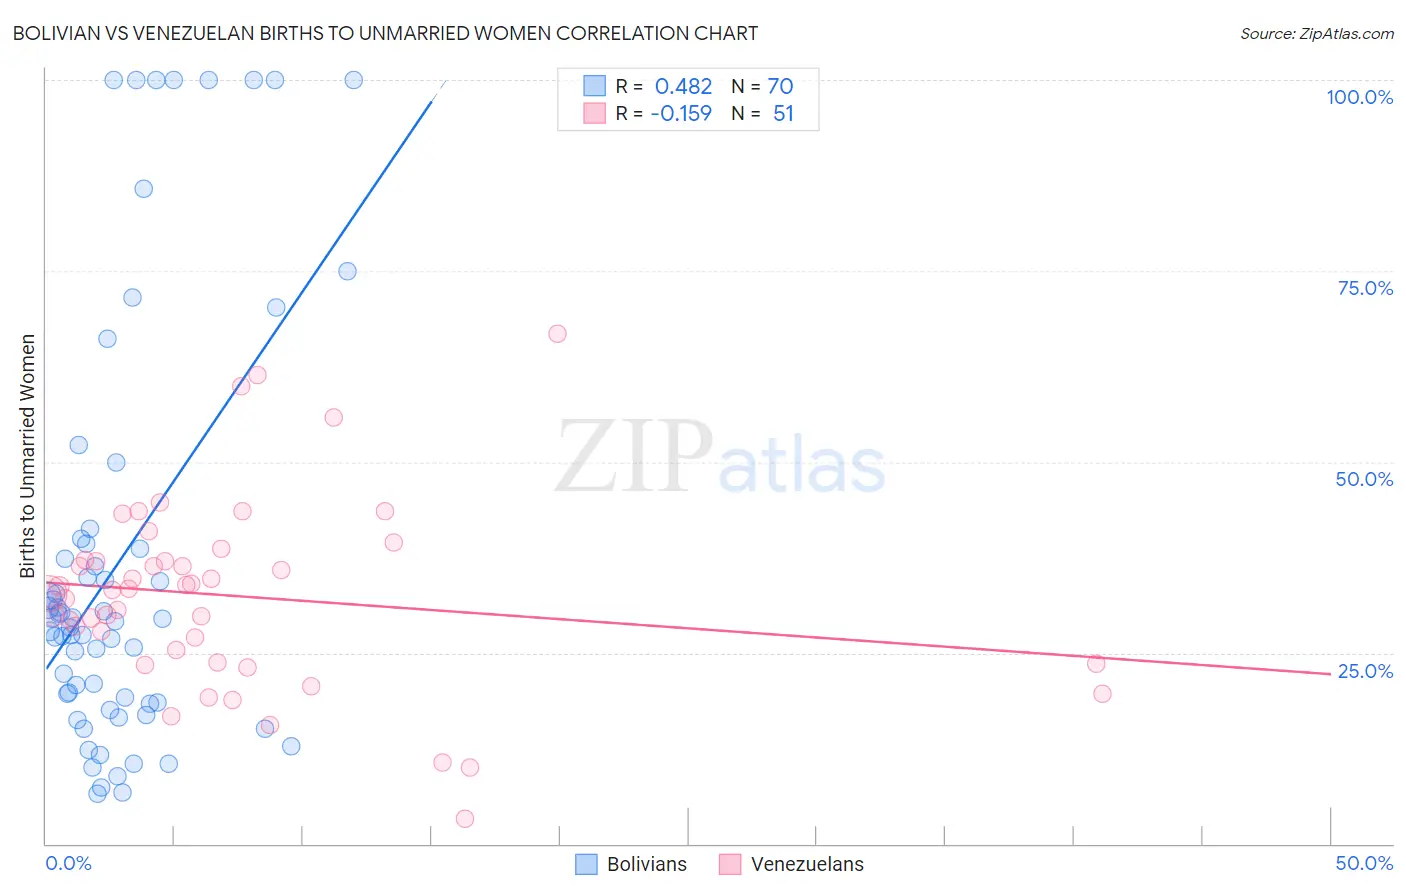
Bolivian vs Venezuelan Births to Unmarried Women Correlation Chart
The statistical analysis conducted on geographies consisting of 177,966,984 people shows a moderate positive correlation between the proportion of Bolivians and percentage of births to unmarried women in the United States with a correlation coefficient (R) of 0.482 and weighted average of 28.5%. Similarly, the statistical analysis conducted on geographies consisting of 290,839,200 people shows a poor negative correlation between the proportion of Venezuelans and percentage of births to unmarried women in the United States with a correlation coefficient (R) of -0.159 and weighted average of 31.7%, a difference of 11.3%.
Births to Unmarried Women Correlation Summary
| Measurement | Bolivian | Venezuelan |
| Minimum | 6.5% | 3.3% |
| Maximum | 100.0% | 66.7% |
| Range | 93.5% | 63.4% |
| Mean | 37.1% | 32.5% |
| Median | 29.4% | 33.2% |
| Interquartile 25% (IQ1) | 18.5% | 23.7% |
| Interquartile 75% (IQ3) | 39.3% | 37.2% |
| Interquartile Range (IQR) | 20.8% | 13.4% |
| Standard Deviation (Sample) | 27.8% | 12.5% |
| Standard Deviation (Population) | 27.6% | 12.3% |
Similar Demographics by Births to Unmarried Women
Demographics Similar to Bolivians by Births to Unmarried Women
In terms of births to unmarried women, the demographic groups most similar to Bolivians are Immigrants from Europe (28.4%, a difference of 0.040%), Laotian (28.5%, a difference of 0.060%), Palestinian (28.4%, a difference of 0.090%), Immigrants from Egypt (28.4%, a difference of 0.20%), and Immigrants from Czechoslovakia (28.4%, a difference of 0.22%).
| Demographics | Rating | Rank | Births to Unmarried Women |
| Egyptians | 99.0 /100 | #62 | Exceptional 28.2% |
| Immigrants | Serbia | 98.9 /100 | #63 | Exceptional 28.3% |
| Tongans | 98.8 /100 | #64 | Exceptional 28.4% |
| Immigrants | Czechoslovakia | 98.8 /100 | #65 | Exceptional 28.4% |
| Immigrants | Egypt | 98.8 /100 | #66 | Exceptional 28.4% |
| Palestinians | 98.7 /100 | #67 | Exceptional 28.4% |
| Immigrants | Europe | 98.7 /100 | #68 | Exceptional 28.4% |
| Bolivians | 98.7 /100 | #69 | Exceptional 28.5% |
| Laotians | 98.6 /100 | #70 | Exceptional 28.5% |
| Jordanians | 98.5 /100 | #71 | Exceptional 28.5% |
| Immigrants | Sweden | 98.5 /100 | #72 | Exceptional 28.5% |
| Albanians | 98.5 /100 | #73 | Exceptional 28.5% |
| Immigrants | Bolivia | 98.5 /100 | #74 | Exceptional 28.6% |
| Immigrants | Switzerland | 98.4 /100 | #75 | Exceptional 28.6% |
| Israelis | 98.4 /100 | #76 | Exceptional 28.6% |
Demographics Similar to Venezuelans by Births to Unmarried Women
In terms of births to unmarried women, the demographic groups most similar to Venezuelans are Immigrants from Yemen (31.7%, a difference of 0.020%), Immigrants from Eritrea (31.7%, a difference of 0.040%), Finnish (31.7%, a difference of 0.050%), Immigrants from Venezuela (31.7%, a difference of 0.080%), and Guamanian/Chamorro (31.6%, a difference of 0.13%).
| Demographics | Rating | Rank | Births to Unmarried Women |
| Dutch | 55.3 /100 | #167 | Average 31.5% |
| Belgians | 52.4 /100 | #168 | Average 31.6% |
| Slavs | 52.0 /100 | #169 | Average 31.6% |
| Guamanians/Chamorros | 51.3 /100 | #170 | Average 31.6% |
| Finns | 50.5 /100 | #171 | Average 31.7% |
| Immigrants | Eritrea | 50.4 /100 | #172 | Average 31.7% |
| Immigrants | Yemen | 50.2 /100 | #173 | Average 31.7% |
| Venezuelans | 50.0 /100 | #174 | Average 31.7% |
| Immigrants | Venezuela | 49.2 /100 | #175 | Average 31.7% |
| Scottish | 48.1 /100 | #176 | Average 31.7% |
| South American Indians | 47.7 /100 | #177 | Average 31.7% |
| English | 47.4 /100 | #178 | Average 31.7% |
| South Americans | 46.9 /100 | #179 | Average 31.8% |
| Moroccans | 45.7 /100 | #180 | Average 31.8% |
| Immigrants | Peru | 45.1 /100 | #181 | Average 31.8% |