Native/Alaskan vs Immigrants from Malaysia Births to Unmarried Women

COMPARE

Native/Alaskan
Race
Ancestry
AfghanAfricanAlaska NativeAlaskan AthabascanAlbanianAleutAlsatianAmericanApacheArabArapahoArgentineanArmenianAssyrian/Chaldean/SyriacAustralianAustrianBahamianBangladeshiBarbadianBasqueBelgianBelizeanBermudanBhutaneseBlackfeetBolivianBrazilianBritishBritish West IndianBulgarianBurmeseCajunCambodianCanadianCape VerdeanCarpatho RusynCelticCentral AmericanCentral American IndianCherokeeCheyenneChickasawChileanChineseChippewaChoctawColombianColvilleComancheCosta RicanCreeCreekCroatianCrowCubanCypriotCzechCzechoslovakianDanishDelawareDominicanDutchDutch West IndianEastern EuropeanEcuadorianEgyptianEnglishEstonianEthiopianEuropeanFijianFilipinoFinnishFrenchFrench American IndianFrench CanadianGermanGerman RussianGhanaianGreekGuamanian/ChamorroGuatemalanGuyaneseHaitianHmongHonduranHopiHoumaHungarianIcelanderIndian (Asian)IndonesianInupiatIranianIraqiIrishIroquoisIsraeliItalianJamaicanJapaneseJordanianKenyanKiowaKoreanLaotianLatvianLebaneseLiberianLithuanianLumbeeLuxembourgerMacedonianMalaysianMalteseMarshalleseMenomineeMexicanMexican American IndianMongolianMoroccanNative HawaiianNavajoNepaleseNew ZealanderNicaraguanNigerianNorthern EuropeanNorwegianOkinawanOsageOttawaPaiutePakistaniPalestinianPanamanianParaguayanPennsylvania GermanPeruvianPimaPolishPortuguesePotawatomiPuebloPuerto RicanPuget Sound SalishRomanianRussianSalvadoranSamoanScandinavianScotch-IrishScottishSeminoleSenegaleseSerbianShoshoneSierra LeoneanSiouxSlavicSlovakSloveneSomaliSouth AfricanSouth AmericanSouth American IndianSoviet UnionSpaniardSpanishSpanish AmericanSpanish American IndianSri LankanSubsaharan AfricanSudaneseSwedishSwissSyrianTaiwaneseThaiTlingit-HaidaTohono O'OdhamTonganTrinidadian and TobagonianTsimshianTurkishU.S. Virgin IslanderUgandanUkrainianUruguayanUteVenezuelanVietnameseWelshWest IndianYakamaYaquiYugoslavianYumanYup'ikZimbabwean
Immigration
NonimmigrantsImmigrantsAfghanistanAfricaAlbaniaArgentinaArmeniaAsiaAustraliaAustriaBahamasBangladeshBarbadosBelarusBelgiumBelizeBoliviaBosnia and HerzegovinaBrazilBulgariaBurma/MyanmarCabo VerdeCambodiaCameroonCanadaCaribbeanCentral AmericaChileChinaColombiaCongoCosta RicaCroatiaCubaCzechoslovakiaDenmarkDominicaDominican RepublicEastern AfricaEastern AsiaEastern EuropeEcuadorEgyptEl SalvadorEnglandEritreaEthiopiaEuropeFijiFranceGermanyGhanaGreeceGrenadaGuatemalaGuyanaHaitiHondurasHong KongHungaryIndiaIndonesiaIranIraqIrelandIsraelItalyJamaicaJapanJordanKazakhstanKenyaKoreaKuwaitLaosLatin AmericaLatviaLebanonLiberiaLithuaniaMexicoMicronesiaMiddle AfricaMoldovaMoroccoNepalNetherlandsNicaraguaNigeriaNorth AmericaNorth MacedoniaNorthern AfricaNorthern EuropeNorwayOceaniaPakistanPanamaPeruPhilippinesPolandPortugalRomaniaRussiaSaudi ArabiaScotlandSenegalSerbiaSierra LeoneSingaporeSomaliaSouth AfricaSouth AmericaSouth Central AsiaSouth Eastern AsiaSouthern EuropeSpainSri LankaSt. Vincent and the GrenadinesSudanSwedenSwitzerlandSyriaTaiwanThailandTrinidad and TobagoTurkeyUgandaUkraineUruguayUzbekistanVenezuelaVietnamWest IndiesWestern AfricaWestern AsiaWestern EuropeYemenZaireZimbabweAzores
Immigrants from Malaysia
Race
Ancestry
AfghanAfricanAlaska NativeAlaskan AthabascanAlbanianAleutAlsatianAmericanApacheArabArapahoArgentineanArmenianAssyrian/Chaldean/SyriacAustralianAustrianBahamianBangladeshiBarbadianBasqueBelgianBelizeanBermudanBhutaneseBlackfeetBolivianBrazilianBritishBritish West IndianBulgarianBurmeseCajunCambodianCanadianCape VerdeanCarpatho RusynCelticCentral AmericanCentral American IndianCherokeeCheyenneChickasawChileanChineseChippewaChoctawColombianColvilleComancheCosta RicanCreeCreekCroatianCrowCubanCypriotCzechCzechoslovakianDanishDelawareDominicanDutchDutch West IndianEastern EuropeanEcuadorianEgyptianEnglishEstonianEthiopianEuropeanFijianFilipinoFinnishFrenchFrench American IndianFrench CanadianGermanGerman RussianGhanaianGreekGuamanian/ChamorroGuatemalanGuyaneseHaitianHmongHonduranHopiHoumaHungarianIcelanderIndian (Asian)IndonesianInupiatIranianIraqiIrishIroquoisIsraeliItalianJamaicanJapaneseJordanianKenyanKiowaKoreanLaotianLatvianLebaneseLiberianLithuanianLumbeeLuxembourgerMacedonianMalaysianMalteseMarshalleseMenomineeMexicanMexican American IndianMongolianMoroccanNative HawaiianNavajoNepaleseNew ZealanderNicaraguanNigerianNorthern EuropeanNorwegianOkinawanOsageOttawaPaiutePakistaniPalestinianPanamanianParaguayanPennsylvania GermanPeruvianPimaPolishPortuguesePotawatomiPuebloPuerto RicanPuget Sound SalishRomanianRussianSalvadoranSamoanScandinavianScotch-IrishScottishSeminoleSenegaleseSerbianShoshoneSierra LeoneanSiouxSlavicSlovakSloveneSomaliSouth AfricanSouth AmericanSouth American IndianSoviet UnionSpaniardSpanishSpanish AmericanSpanish American IndianSri LankanSubsaharan AfricanSudaneseSwedishSwissSyrianTaiwaneseThaiTlingit-HaidaTohono O'OdhamTonganTrinidadian and TobagonianTsimshianTurkishU.S. Virgin IslanderUgandanUkrainianUruguayanUteVenezuelanVietnameseWelshWest IndianYakamaYaquiYugoslavianYumanYup'ikZimbabwean
Immigration
NonimmigrantsImmigrantsAfghanistanAfricaAlbaniaArgentinaArmeniaAsiaAustraliaAustriaBahamasBangladeshBarbadosBelarusBelgiumBelizeBoliviaBosnia and HerzegovinaBrazilBulgariaBurma/MyanmarCabo VerdeCambodiaCameroonCanadaCaribbeanCentral AmericaChileChinaColombiaCongoCosta RicaCroatiaCubaCzechoslovakiaDenmarkDominicaDominican RepublicEastern AfricaEastern AsiaEastern EuropeEcuadorEgyptEl SalvadorEnglandEritreaEthiopiaEuropeFijiFranceGermanyGhanaGreeceGrenadaGuatemalaGuyanaHaitiHondurasHong KongHungaryIndiaIndonesiaIranIraqIrelandIsraelItalyJamaicaJapanJordanKazakhstanKenyaKoreaKuwaitLaosLatin AmericaLatviaLebanonLiberiaLithuaniaMalaysiaMexicoMicronesiaMiddle AfricaMoldovaMoroccoNepalNetherlandsNicaraguaNigeriaNorth AmericaNorth MacedoniaNorthern AfricaNorthern EuropeNorwayOceaniaPakistanPanamaPeruPhilippinesPolandPortugalRomaniaRussiaSaudi ArabiaScotlandSenegalSerbiaSierra LeoneSingaporeSomaliaSouth AfricaSouth AmericaSouth Central AsiaSouth Eastern AsiaSouthern EuropeSpainSri LankaSt. Vincent and the GrenadinesSudanSwedenSwitzerlandSyriaTaiwanThailandTrinidad and TobagoTurkeyUgandaUkraineUruguayUzbekistanVenezuelaVietnamWest IndiesWestern AfricaWestern AsiaWestern EuropeYemenZaireZimbabweAzores
Births to Unmarried Women
Income
Poverty
Unemployment
Labor Participation
Family Structure
Vehicle Availability
Education Level
Disability

Births to Unmarried Women Comparison

Natives/Alaskans

Immigrants from Malaysia

Tragic
Exceptional
43.0%
BIRTHS TO UNMARRIED WOMEN
0.0/ 100
METRIC RATING
331st/ 347
METRIC RANK
27.4%
BIRTHS TO UNMARRIED WOMEN
99.7/ 100
METRIC RATING
39th/ 347
METRIC RANK

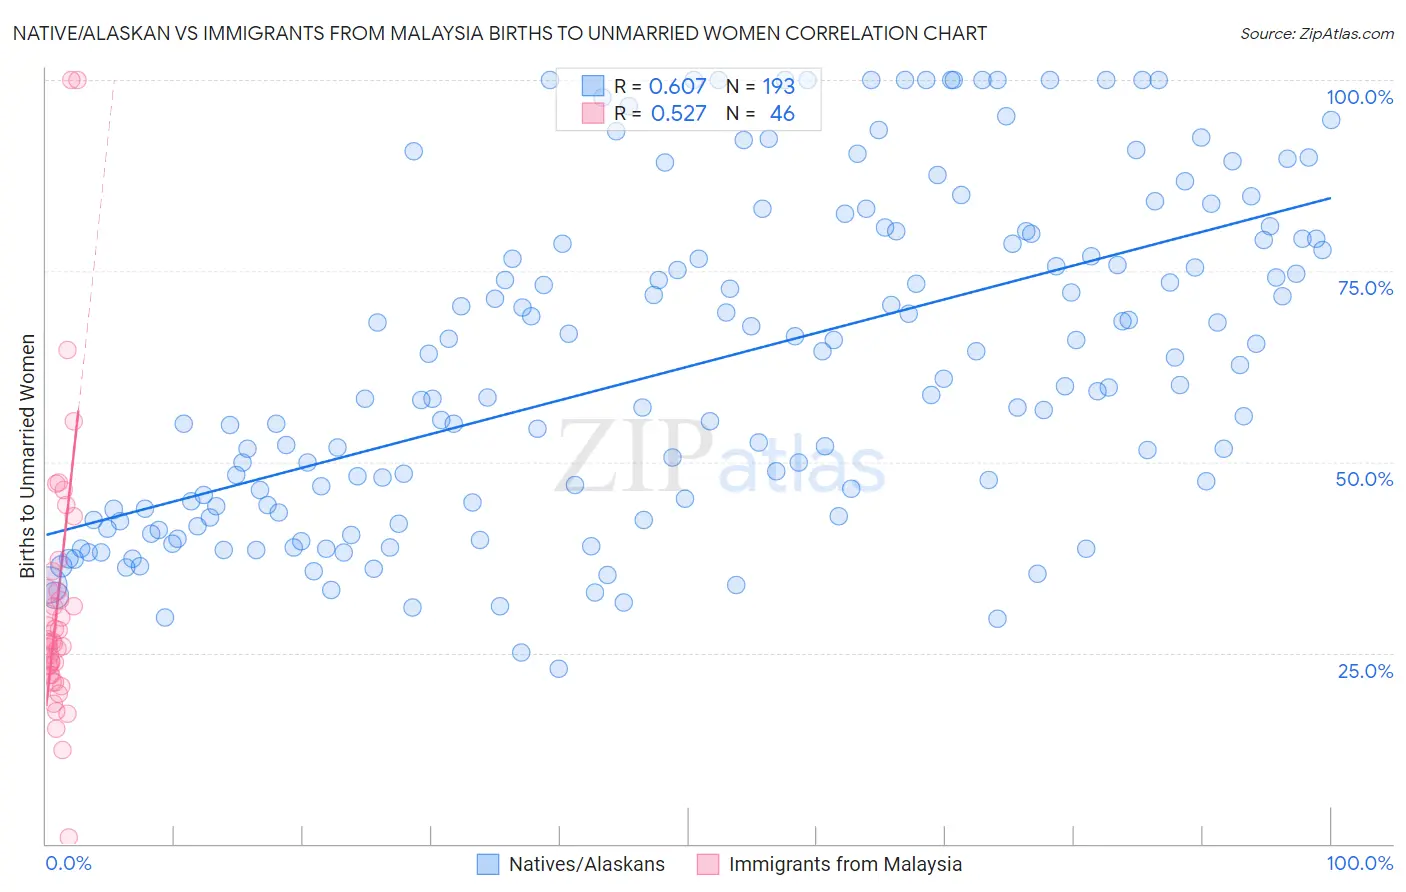
Native/Alaskan vs Immigrants from Malaysia Births to Unmarried Women Correlation Chart

The statistical analysis conducted on geographies consisting of 471,404,476 people shows a significant positive correlation between the proportion of Natives/Alaskans and percentage of births to unmarried women in the United States with a correlation coefficient (R) of 0.607 and weighted average of 43.0%. Similarly, the statistical analysis conducted on geographies consisting of 189,196,232 people shows a substantial positive correlation between the proportion of Immigrants from Malaysia and percentage of births to unmarried women in the United States with a correlation coefficient (R) of 0.527 and weighted average of 27.4%, a difference of 57.1%.
Native/Alaskan vs Immigrants from Malaysia Births to Unmarried Women

Births to Unmarried Women Correlation Summary

MeasurementNative/AlaskanImmigrants from Malaysia
Minimum22.9%0.90%
Maximum100.0%100.0%
Range77.1%99.1%
Mean62.5%31.7%
Median59.8%26.4%
Interquartile 25% (IQ1)43.2%22.1%
Interquartile 75% (IQ3)79.1%33.1%
Interquartile Range (IQR)35.9%11.1%
Standard Deviation (Sample)21.3%18.6%
Standard Deviation (Population)21.3%18.4%

Similar Demographics by Births to Unmarried Women

Demographics Similar to Natives/Alaskans by Births to Unmarried Women

In terms of births to unmarried women, the demographic groups most similar to Natives/Alaskans are Kiowa (43.1%, a difference of 0.35%), Chippewa (42.6%, a difference of 0.83%), Paiute (42.5%, a difference of 1.2%), Immigrants from Cabo Verde (42.2%, a difference of 1.8%), and Tsimshian (42.2%, a difference of 2.0%).
DemographicsRating | RankBirths to Unmarried Women
Cape Verdeans
0.0
/100
|
#324
Tragic
41.3%
Cheyenne
0.0
/100
|
#325
Tragic
41.3%
Immigrants | Cuba
0.0
/100
|
#326
Tragic
41.5%
Tsimshian
0.0
/100
|
#327
Tragic
42.2%
Immigrants | Cabo Verde
0.0
/100
|
#328
Tragic
42.2%
Paiute
0.0
/100
|
#329
Tragic
42.5%
Chippewa
0.0
/100
|
#330
Tragic
42.6%
Natives/Alaskans
0.0
/100
|
#331
Tragic
43.0%
Kiowa
0.0
/100
|
#332
Tragic
43.1%
Blacks/African Americans
0.0
/100
|
#333
Tragic
44.3%
Yuman
0.0
/100
|
#334
Tragic
44.4%
Colville
0.0
/100
|
#335
Tragic
45.3%
Puerto Ricans
0.0
/100
|
#336
Tragic
45.7%
Houma
0.0
/100
|
#337
Tragic
46.6%
Arapaho
0.0
/100
|
#338
Tragic
47.1%

Demographics Similar to Immigrants from Malaysia by Births to Unmarried Women

In terms of births to unmarried women, the demographic groups most similar to Immigrants from Malaysia are Immigrants from Moldova (27.3%, a difference of 0.28%), Turkish (27.4%, a difference of 0.32%), Immigrants from Ukraine (27.2%, a difference of 0.43%), Immigrants from Western Asia (27.2%, a difference of 0.51%), and Immigrants from Ireland (27.2%, a difference of 0.59%).
DemographicsRating | RankBirths to Unmarried Women
Immigrants | Russia
99.8
/100
|
#32
Exceptional
27.1%
Immigrants | Sri Lanka
99.8
/100
|
#33
Exceptional
27.2%
Immigrants | Pakistan
99.8
/100
|
#34
Exceptional
27.2%
Immigrants | Ireland
99.7
/100
|
#35
Exceptional
27.2%
Immigrants | Western Asia
99.7
/100
|
#36
Exceptional
27.2%
Immigrants | Ukraine
99.7
/100
|
#37
Exceptional
27.2%
Immigrants | Moldova
99.7
/100
|
#38
Exceptional
27.3%
Immigrants | Malaysia
99.7
/100
|
#39
Exceptional
27.4%
Turks
99.6
/100
|
#40
Exceptional
27.4%
Iraqis
99.6
/100
|
#41
Exceptional
27.6%
Immigrants | Eastern Europe
99.6
/100
|
#42
Exceptional
27.6%
Immigrants | Bulgaria
99.6
/100
|
#43
Exceptional
27.6%
Immigrants | Indonesia
99.5
/100
|
#44
Exceptional
27.7%
Latvians
99.5
/100
|
#45
Exceptional
27.7%
Immigrants | Lithuania
99.5
/100
|
#46
Exceptional
27.7%