Native/Alaskan vs South African Births to Unmarried Women
COMPARE
Native/Alaskan
South African
Births to Unmarried Women
Births to Unmarried Women Comparison
Natives/Alaskans
South Africans
43.0%
BIRTHS TO UNMARRIED WOMEN
0.0/ 100
METRIC RATING
331st/ 347
METRIC RANK
30.5%
BIRTHS TO UNMARRIED WOMEN
82.7/ 100
METRIC RATING
142nd/ 347
METRIC RANK
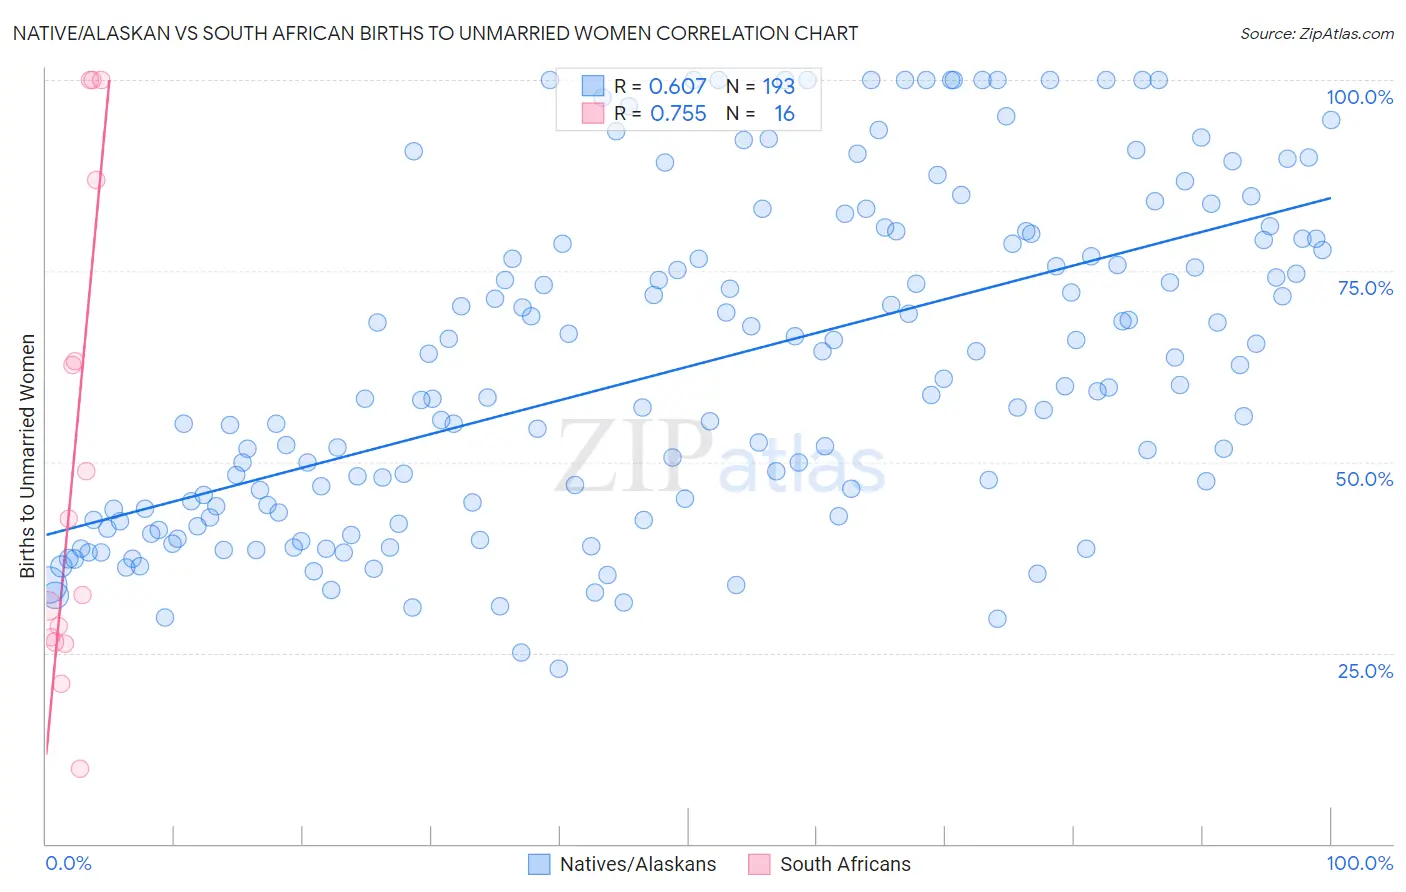
Native/Alaskan vs South African Births to Unmarried Women Correlation Chart
The statistical analysis conducted on geographies consisting of 471,404,476 people shows a significant positive correlation between the proportion of Natives/Alaskans and percentage of births to unmarried women in the United States with a correlation coefficient (R) of 0.607 and weighted average of 43.0%. Similarly, the statistical analysis conducted on geographies consisting of 173,176,697 people shows a strong positive correlation between the proportion of South Africans and percentage of births to unmarried women in the United States with a correlation coefficient (R) of 0.755 and weighted average of 30.5%, a difference of 40.9%.
Births to Unmarried Women Correlation Summary
| Measurement | Native/Alaskan | South African |
| Minimum | 22.9% | 9.7% |
| Maximum | 100.0% | 100.0% |
| Range | 77.1% | 90.3% |
| Mean | 62.5% | 50.4% |
| Median | 59.8% | 37.5% |
| Interquartile 25% (IQ1) | 43.2% | 26.7% |
| Interquartile 75% (IQ3) | 79.1% | 75.0% |
| Interquartile Range (IQR) | 35.9% | 48.3% |
| Standard Deviation (Sample) | 21.3% | 31.1% |
| Standard Deviation (Population) | 21.3% | 30.1% |
Similar Demographics by Births to Unmarried Women
Demographics Similar to Natives/Alaskans by Births to Unmarried Women
In terms of births to unmarried women, the demographic groups most similar to Natives/Alaskans are Kiowa (43.1%, a difference of 0.35%), Chippewa (42.6%, a difference of 0.83%), Paiute (42.5%, a difference of 1.2%), Immigrants from Cabo Verde (42.2%, a difference of 1.8%), and Tsimshian (42.2%, a difference of 2.0%).
| Demographics | Rating | Rank | Births to Unmarried Women |
| Cape Verdeans | 0.0 /100 | #324 | Tragic 41.3% |
| Cheyenne | 0.0 /100 | #325 | Tragic 41.3% |
| Immigrants | Cuba | 0.0 /100 | #326 | Tragic 41.5% |
| Tsimshian | 0.0 /100 | #327 | Tragic 42.2% |
| Immigrants | Cabo Verde | 0.0 /100 | #328 | Tragic 42.2% |
| Paiute | 0.0 /100 | #329 | Tragic 42.5% |
| Chippewa | 0.0 /100 | #330 | Tragic 42.6% |
| Natives/Alaskans | 0.0 /100 | #331 | Tragic 43.0% |
| Kiowa | 0.0 /100 | #332 | Tragic 43.1% |
| Blacks/African Americans | 0.0 /100 | #333 | Tragic 44.3% |
| Yuman | 0.0 /100 | #334 | Tragic 44.4% |
| Colville | 0.0 /100 | #335 | Tragic 45.3% |
| Puerto Ricans | 0.0 /100 | #336 | Tragic 45.7% |
| Houma | 0.0 /100 | #337 | Tragic 46.6% |
| Arapaho | 0.0 /100 | #338 | Tragic 47.1% |
Demographics Similar to South Africans by Births to Unmarried Women
In terms of births to unmarried women, the demographic groups most similar to South Africans are Immigrants from Uganda (30.5%, a difference of 0.020%), Pakistani (30.5%, a difference of 0.060%), Swiss (30.5%, a difference of 0.080%), Czech (30.5%, a difference of 0.090%), and Immigrants from Canada (30.4%, a difference of 0.19%).
| Demographics | Rating | Rank | Births to Unmarried Women |
| Brazilians | 84.8 /100 | #135 | Excellent 30.4% |
| Immigrants | Scotland | 84.6 /100 | #136 | Excellent 30.4% |
| Immigrants | Philippines | 83.9 /100 | #137 | Excellent 30.4% |
| Puget Sound Salish | 83.9 /100 | #138 | Excellent 30.4% |
| Immigrants | Canada | 83.7 /100 | #139 | Excellent 30.4% |
| Swiss | 83.1 /100 | #140 | Excellent 30.5% |
| Pakistanis | 83.0 /100 | #141 | Excellent 30.5% |
| South Africans | 82.7 /100 | #142 | Excellent 30.5% |
| Immigrants | Uganda | 82.6 /100 | #143 | Excellent 30.5% |
| Czechs | 82.1 /100 | #144 | Excellent 30.5% |
| Immigrants | North America | 81.5 /100 | #145 | Excellent 30.6% |
| Northern Europeans | 81.4 /100 | #146 | Excellent 30.6% |
| Immigrants | Oceania | 81.2 /100 | #147 | Excellent 30.6% |
| Chileans | 79.1 /100 | #148 | Good 30.7% |
| Serbians | 78.8 /100 | #149 | Good 30.7% |