Tongan vs Croatian College, Under 1 year
COMPARE
Tongan
Croatian
College, Under 1 year
College, Under 1 year Comparison
Tongans
Croatians
64.5%
COLLEGE, UNDER 1 YEAR
21.2/ 100
METRIC RATING
196th/ 347
METRIC RANK
68.3%
COLLEGE, UNDER 1 YEAR
98.2/ 100
METRIC RATING
88th/ 347
METRIC RANK
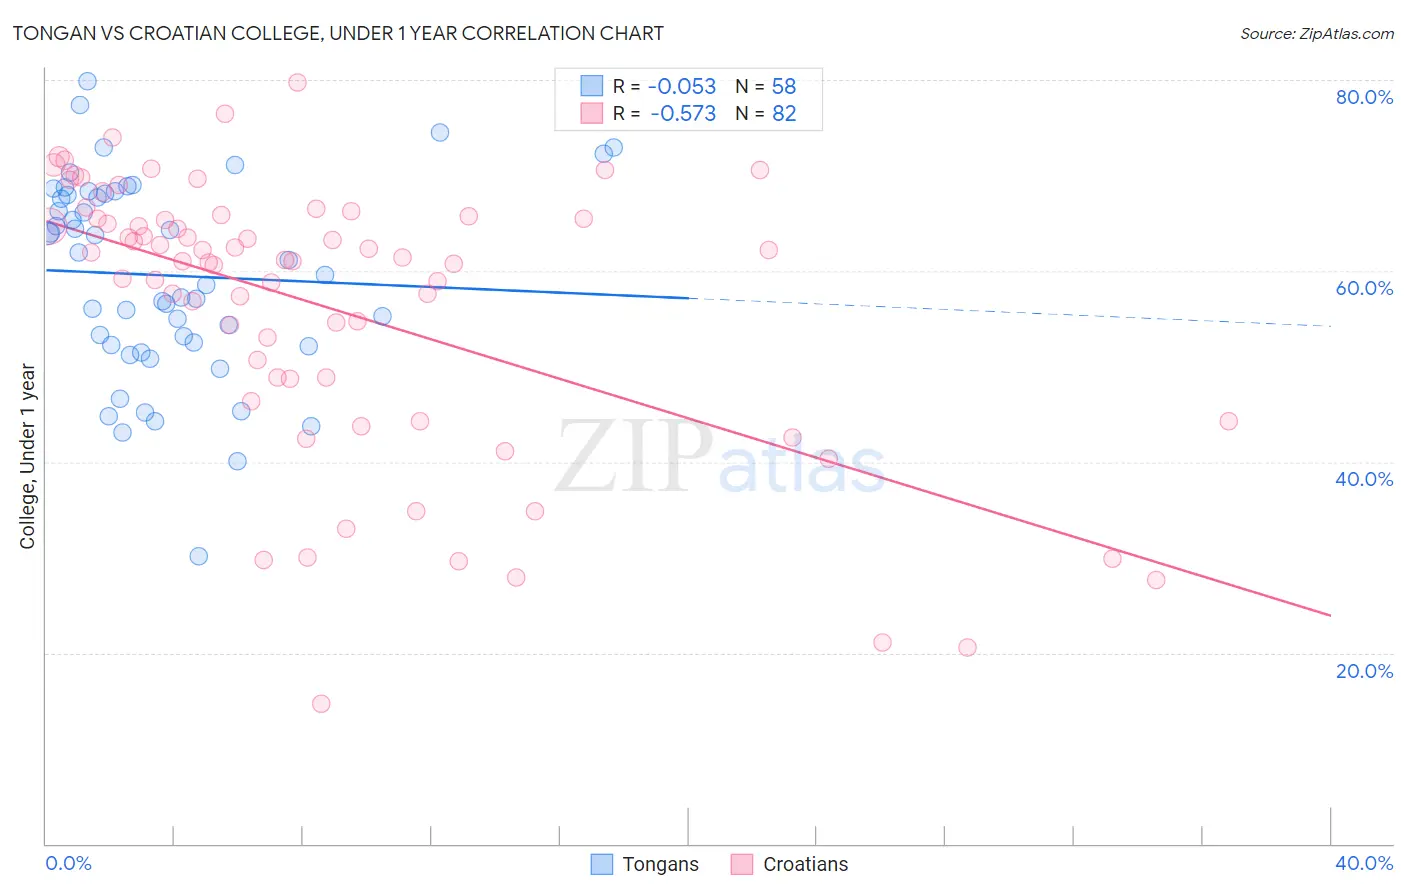
Tongan vs Croatian College, Under 1 year Correlation Chart
The statistical analysis conducted on geographies consisting of 102,908,759 people shows a slight negative correlation between the proportion of Tongans and percentage of population with at least college, under 1 year education in the United States with a correlation coefficient (R) of -0.053 and weighted average of 64.5%. Similarly, the statistical analysis conducted on geographies consisting of 375,730,237 people shows a substantial negative correlation between the proportion of Croatians and percentage of population with at least college, under 1 year education in the United States with a correlation coefficient (R) of -0.573 and weighted average of 68.3%, a difference of 6.0%.
College, Under 1 year Correlation Summary
| Measurement | Tongan | Croatian |
| Minimum | 30.2% | 14.6% |
| Maximum | 79.8% | 79.7% |
| Range | 49.7% | 65.1% |
| Mean | 59.5% | 56.1% |
| Median | 60.3% | 61.1% |
| Interquartile 25% (IQ1) | 52.3% | 48.7% |
| Interquartile 75% (IQ3) | 68.0% | 65.5% |
| Interquartile Range (IQR) | 15.7% | 16.8% |
| Standard Deviation (Sample) | 10.4% | 14.5% |
| Standard Deviation (Population) | 10.4% | 14.5% |
Similar Demographics by College, Under 1 year
Demographics Similar to Tongans by College, Under 1 year
In terms of college, under 1 year, the demographic groups most similar to Tongans are Immigrants from South Eastern Asia (64.5%, a difference of 0.050%), Costa Rican (64.4%, a difference of 0.11%), Immigrants from Cameroon (64.6%, a difference of 0.21%), Tsimshian (64.3%, a difference of 0.24%), and Panamanian (64.3%, a difference of 0.31%).
| Demographics | Rating | Rank | College, Under 1 year |
| Spanish | 31.6 /100 | #189 | Fair 64.9% |
| Immigrants | Philippines | 30.1 /100 | #190 | Fair 64.8% |
| Immigrants | Armenia | 28.1 /100 | #191 | Fair 64.7% |
| Immigrants | Thailand | 27.0 /100 | #192 | Fair 64.7% |
| Slovaks | 26.7 /100 | #193 | Fair 64.7% |
| Immigrants | Cameroon | 24.6 /100 | #194 | Fair 64.6% |
| Immigrants | South Eastern Asia | 22.1 /100 | #195 | Fair 64.5% |
| Tongans | 21.2 /100 | #196 | Fair 64.5% |
| Costa Ricans | 19.6 /100 | #197 | Poor 64.4% |
| Tsimshian | 17.9 /100 | #198 | Poor 64.3% |
| Panamanians | 17.0 /100 | #199 | Poor 64.3% |
| Nigerians | 16.7 /100 | #200 | Poor 64.3% |
| French Canadians | 16.3 /100 | #201 | Poor 64.2% |
| South Americans | 16.2 /100 | #202 | Poor 64.2% |
| Uruguayans | 15.6 /100 | #203 | Poor 64.2% |
Demographics Similar to Croatians by College, Under 1 year
In terms of college, under 1 year, the demographic groups most similar to Croatians are Ethiopian (68.3%, a difference of 0.010%), Chinese (68.3%, a difference of 0.020%), Immigrants from Lebanon (68.3%, a difference of 0.040%), Immigrants from Hungary (68.3%, a difference of 0.050%), and Egyptian (68.3%, a difference of 0.050%).
| Demographics | Rating | Rank | College, Under 1 year |
| Immigrants | Greece | 98.5 /100 | #81 | Exceptional 68.4% |
| Norwegians | 98.4 /100 | #82 | Exceptional 68.4% |
| Argentineans | 98.4 /100 | #83 | Exceptional 68.4% |
| Immigrants | Hungary | 98.3 /100 | #84 | Exceptional 68.3% |
| Egyptians | 98.3 /100 | #85 | Exceptional 68.3% |
| Immigrants | Lebanon | 98.3 /100 | #86 | Exceptional 68.3% |
| Chinese | 98.3 /100 | #87 | Exceptional 68.3% |
| Croatians | 98.2 /100 | #88 | Exceptional 68.3% |
| Ethiopians | 98.2 /100 | #89 | Exceptional 68.3% |
| Icelanders | 98.1 /100 | #90 | Exceptional 68.3% |
| Europeans | 98.1 /100 | #91 | Exceptional 68.2% |
| Luxembourgers | 98.1 /100 | #92 | Exceptional 68.2% |
| Romanians | 97.9 /100 | #93 | Exceptional 68.2% |
| Armenians | 97.7 /100 | #94 | Exceptional 68.1% |
| Immigrants | Pakistan | 97.5 /100 | #95 | Exceptional 68.0% |