Syrian vs Bahamian College, 1 year or more
COMPARE
Syrian
Bahamian
College, 1 year or more
College, 1 year or more Comparison
Syrians
Bahamians
61.9%
COLLEGE, 1 YEAR OR MORE
95.7/ 100
METRIC RATING
108th/ 347
METRIC RANK
54.5%
COLLEGE, 1 YEAR OR MORE
0.2/ 100
METRIC RATING
271st/ 347
METRIC RANK
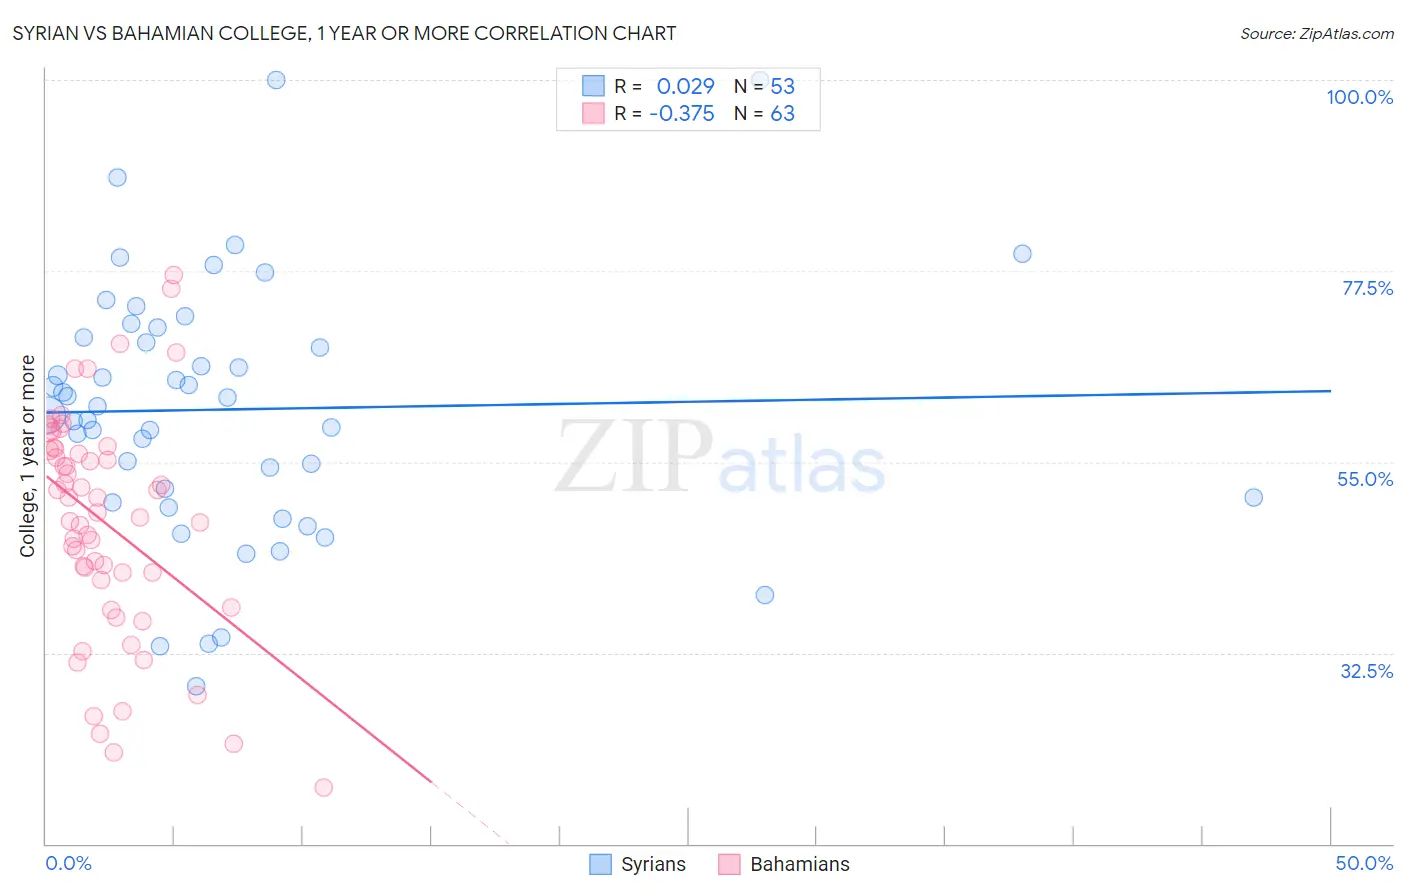
Syrian vs Bahamian College, 1 year or more Correlation Chart
The statistical analysis conducted on geographies consisting of 266,306,496 people shows no correlation between the proportion of Syrians and percentage of population with at least college, 1 year or more education in the United States with a correlation coefficient (R) of 0.029 and weighted average of 61.9%. Similarly, the statistical analysis conducted on geographies consisting of 112,705,508 people shows a mild negative correlation between the proportion of Bahamians and percentage of population with at least college, 1 year or more education in the United States with a correlation coefficient (R) of -0.375 and weighted average of 54.5%, a difference of 13.6%.
College, 1 year or more Correlation Summary
| Measurement | Syrian | Bahamian |
| Minimum | 28.6% | 16.6% |
| Maximum | 100.0% | 77.1% |
| Range | 71.4% | 60.4% |
| Mean | 61.2% | 47.8% |
| Median | 61.5% | 49.1% |
| Interquartile 25% (IQ1) | 50.5% | 41.0% |
| Interquartile 75% (IQ3) | 70.2% | 56.5% |
| Interquartile Range (IQR) | 19.7% | 15.5% |
| Standard Deviation (Sample) | 15.2% | 13.3% |
| Standard Deviation (Population) | 15.1% | 13.2% |
Similar Demographics by College, 1 year or more
Demographics Similar to Syrians by College, 1 year or more
In terms of college, 1 year or more, the demographic groups most similar to Syrians are Immigrants from Northern Africa (61.9%, a difference of 0.0%), Immigrants from Ukraine (61.9%, a difference of 0.020%), European (61.8%, a difference of 0.020%), Macedonian (61.8%, a difference of 0.020%), and Austrian (61.8%, a difference of 0.080%).
| Demographics | Rating | Rank | College, 1 year or more |
| Swedes | 96.8 /100 | #101 | Exceptional 62.1% |
| Luxembourgers | 96.7 /100 | #102 | Exceptional 62.1% |
| Afghans | 96.4 /100 | #103 | Exceptional 62.0% |
| Chileans | 96.4 /100 | #104 | Exceptional 62.0% |
| Immigrants | Nepal | 96.3 /100 | #105 | Exceptional 62.0% |
| Palestinians | 96.3 /100 | #106 | Exceptional 62.0% |
| Immigrants | Ukraine | 95.8 /100 | #107 | Exceptional 61.9% |
| Syrians | 95.7 /100 | #108 | Exceptional 61.9% |
| Immigrants | Northern Africa | 95.7 /100 | #109 | Exceptional 61.9% |
| Europeans | 95.6 /100 | #110 | Exceptional 61.8% |
| Macedonians | 95.6 /100 | #111 | Exceptional 61.8% |
| Austrians | 95.4 /100 | #112 | Exceptional 61.8% |
| Ukrainians | 95.2 /100 | #113 | Exceptional 61.8% |
| Danes | 94.8 /100 | #114 | Exceptional 61.7% |
| Norwegians | 94.5 /100 | #115 | Exceptional 61.7% |
Demographics Similar to Bahamians by College, 1 year or more
In terms of college, 1 year or more, the demographic groups most similar to Bahamians are Crow (54.5%, a difference of 0.020%), Comanche (54.4%, a difference of 0.050%), Bangladeshi (54.5%, a difference of 0.060%), Immigrants from Grenada (54.4%, a difference of 0.080%), and British West Indian (54.5%, a difference of 0.090%).
| Demographics | Rating | Rank | College, 1 year or more |
| Immigrants | Micronesia | 0.3 /100 | #264 | Tragic 54.8% |
| Immigrants | Laos | 0.2 /100 | #265 | Tragic 54.7% |
| Potawatomi | 0.2 /100 | #266 | Tragic 54.6% |
| Blackfeet | 0.2 /100 | #267 | Tragic 54.6% |
| British West Indians | 0.2 /100 | #268 | Tragic 54.5% |
| Bangladeshis | 0.2 /100 | #269 | Tragic 54.5% |
| Crow | 0.2 /100 | #270 | Tragic 54.5% |
| Bahamians | 0.2 /100 | #271 | Tragic 54.5% |
| Comanche | 0.2 /100 | #272 | Tragic 54.4% |
| Immigrants | Grenada | 0.2 /100 | #273 | Tragic 54.4% |
| Belizeans | 0.2 /100 | #274 | Tragic 54.4% |
| Americans | 0.2 /100 | #275 | Tragic 54.4% |
| Shoshone | 0.2 /100 | #276 | Tragic 54.3% |
| Ecuadorians | 0.2 /100 | #277 | Tragic 54.3% |
| Immigrants | Jamaica | 0.1 /100 | #278 | Tragic 54.2% |