Pueblo vs Immigrants from Cabo Verde GED/Equivalency
COMPARE
Pueblo
Immigrants from Cabo Verde
GED/Equivalency
GED/Equivalency Comparison
Pueblo
Immigrants from Cabo Verde
82.3%
GED/EQUIVALENCY
0.0/ 100
METRIC RATING
288th/ 347
METRIC RANK
78.9%
GED/EQUIVALENCY
0.0/ 100
METRIC RATING
330th/ 347
METRIC RANK
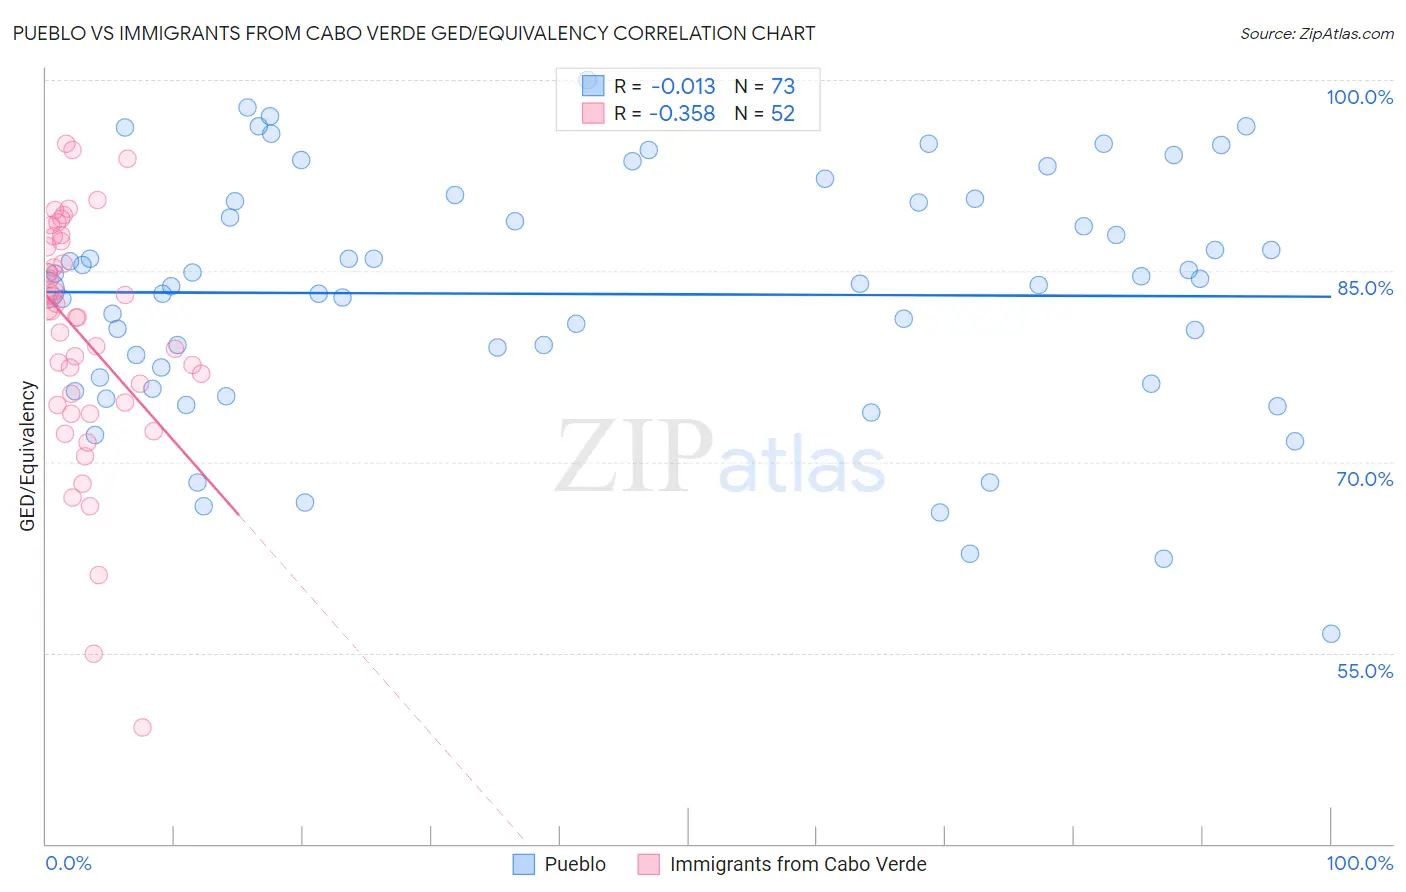
Pueblo vs Immigrants from Cabo Verde GED/Equivalency Correlation Chart
The statistical analysis conducted on geographies consisting of 120,086,468 people shows no correlation between the proportion of Pueblo and percentage of population with at least ged/equivalency education in the United States with a correlation coefficient (R) of -0.013 and weighted average of 82.3%. Similarly, the statistical analysis conducted on geographies consisting of 38,158,504 people shows a mild negative correlation between the proportion of Immigrants from Cabo Verde and percentage of population with at least ged/equivalency education in the United States with a correlation coefficient (R) of -0.358 and weighted average of 78.9%, a difference of 4.3%.
GED/Equivalency Correlation Summary
| Measurement | Pueblo | Immigrants from Cabo Verde |
| Minimum | 56.5% | 49.2% |
| Maximum | 100.0% | 95.0% |
| Range | 43.5% | 45.8% |
| Mean | 83.2% | 79.9% |
| Median | 84.0% | 81.6% |
| Interquartile 25% (IQ1) | 76.4% | 74.6% |
| Interquartile 75% (IQ3) | 90.6% | 87.1% |
| Interquartile Range (IQR) | 14.2% | 12.6% |
| Standard Deviation (Sample) | 9.6% | 9.5% |
| Standard Deviation (Population) | 9.6% | 9.4% |
Similar Demographics by GED/Equivalency
Demographics Similar to Pueblo by GED/Equivalency
In terms of ged/equivalency, the demographic groups most similar to Pueblo are Immigrants from Cambodia (82.2%, a difference of 0.080%), Japanese (82.4%, a difference of 0.10%), Immigrants from West Indies (82.4%, a difference of 0.12%), Cajun (82.4%, a difference of 0.14%), and Immigrants from Barbados (82.4%, a difference of 0.17%).
| Demographics | Rating | Rank | GED/Equivalency |
| Sioux | 0.1 /100 | #281 | Tragic 82.6% |
| Immigrants | Immigrants | 0.1 /100 | #282 | Tragic 82.6% |
| Indonesians | 0.1 /100 | #283 | Tragic 82.5% |
| Immigrants | Barbados | 0.1 /100 | #284 | Tragic 82.4% |
| Cajuns | 0.0 /100 | #285 | Tragic 82.4% |
| Immigrants | West Indies | 0.0 /100 | #286 | Tragic 82.4% |
| Japanese | 0.0 /100 | #287 | Tragic 82.4% |
| Pueblo | 0.0 /100 | #288 | Tragic 82.3% |
| Immigrants | Cambodia | 0.0 /100 | #289 | Tragic 82.2% |
| Haitians | 0.0 /100 | #290 | Tragic 82.1% |
| Cubans | 0.0 /100 | #291 | Tragic 82.0% |
| Paiute | 0.0 /100 | #292 | Tragic 82.0% |
| British West Indians | 0.0 /100 | #293 | Tragic 82.0% |
| Immigrants | St. Vincent and the Grenadines | 0.0 /100 | #294 | Tragic 82.0% |
| Nepalese | 0.0 /100 | #295 | Tragic 81.9% |
Demographics Similar to Immigrants from Cabo Verde by GED/Equivalency
In terms of ged/equivalency, the demographic groups most similar to Immigrants from Cabo Verde are Dominican (79.1%, a difference of 0.16%), Hispanic or Latino (79.1%, a difference of 0.20%), Immigrants from Honduras (78.7%, a difference of 0.24%), Central American (79.2%, a difference of 0.31%), and Yuman (79.2%, a difference of 0.33%).
| Demographics | Rating | Rank | GED/Equivalency |
| Immigrants | Nicaragua | 0.0 /100 | #323 | Tragic 79.9% |
| Mexican American Indians | 0.0 /100 | #324 | Tragic 79.4% |
| Hondurans | 0.0 /100 | #325 | Tragic 79.3% |
| Yuman | 0.0 /100 | #326 | Tragic 79.2% |
| Central Americans | 0.0 /100 | #327 | Tragic 79.2% |
| Hispanics or Latinos | 0.0 /100 | #328 | Tragic 79.1% |
| Dominicans | 0.0 /100 | #329 | Tragic 79.1% |
| Immigrants | Cabo Verde | 0.0 /100 | #330 | Tragic 78.9% |
| Immigrants | Honduras | 0.0 /100 | #331 | Tragic 78.7% |
| Immigrants | Azores | 0.0 /100 | #332 | Tragic 78.7% |
| Salvadorans | 0.0 /100 | #333 | Tragic 78.6% |
| Guatemalans | 0.0 /100 | #334 | Tragic 78.5% |
| Immigrants | Latin America | 0.0 /100 | #335 | Tragic 78.5% |
| Immigrants | Dominican Republic | 0.0 /100 | #336 | Tragic 78.0% |
| Immigrants | Yemen | 0.0 /100 | #337 | Tragic 77.9% |