Immigrants from St. Vincent and the Grenadines vs Immigrants from Trinidad and Tobago GED/Equivalency
COMPARE
Immigrants from St. Vincent and the Grenadines
Immigrants from Trinidad and Tobago
GED/Equivalency
GED/Equivalency Comparison
Immigrants from St. Vincent and the Grenadines
Immigrants from Trinidad and Tobago
82.0%
GED/EQUIVALENCY
0.0/ 100
METRIC RATING
294th/ 347
METRIC RANK
82.8%
GED/EQUIVALENCY
0.1/ 100
METRIC RATING
274th/ 347
METRIC RANK
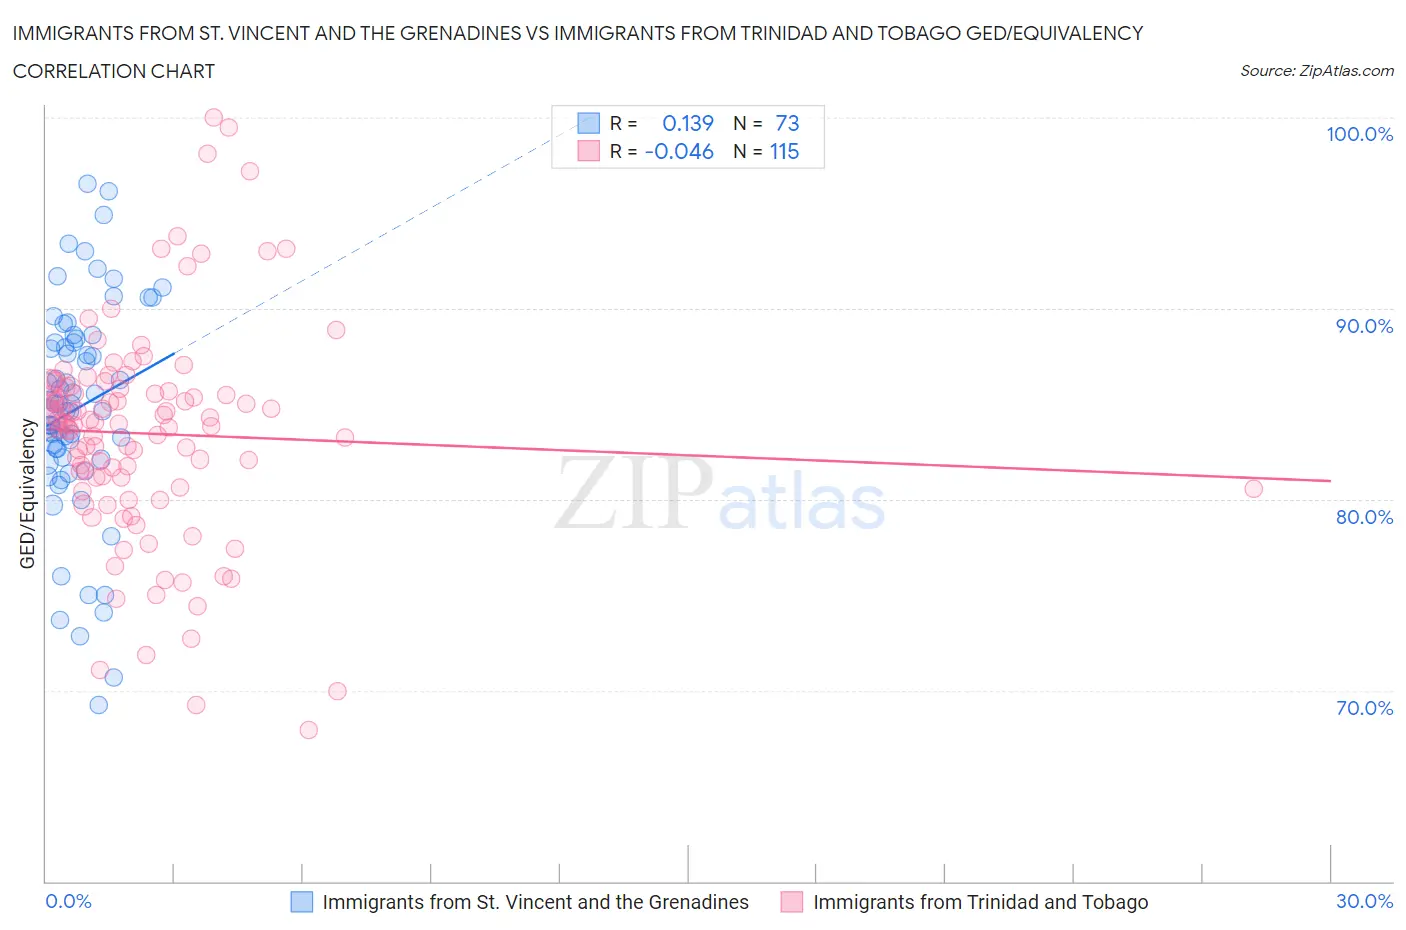
Immigrants from St. Vincent and the Grenadines vs Immigrants from Trinidad and Tobago GED/Equivalency Correlation Chart
The statistical analysis conducted on geographies consisting of 56,191,418 people shows a poor positive correlation between the proportion of Immigrants from St. Vincent and the Grenadines and percentage of population with at least ged/equivalency education in the United States with a correlation coefficient (R) of 0.139 and weighted average of 82.0%. Similarly, the statistical analysis conducted on geographies consisting of 223,527,464 people shows no correlation between the proportion of Immigrants from Trinidad and Tobago and percentage of population with at least ged/equivalency education in the United States with a correlation coefficient (R) of -0.046 and weighted average of 82.8%, a difference of 1.0%.
GED/Equivalency Correlation Summary
| Measurement | Immigrants from St. Vincent and the Grenadines | Immigrants from Trinidad and Tobago |
| Minimum | 69.2% | 67.9% |
| Maximum | 96.6% | 100.0% |
| Range | 27.3% | 32.1% |
| Mean | 84.8% | 83.4% |
| Median | 85.0% | 83.9% |
| Interquartile 25% (IQ1) | 82.1% | 80.6% |
| Interquartile 75% (IQ3) | 88.3% | 85.8% |
| Interquartile Range (IQR) | 6.2% | 5.2% |
| Standard Deviation (Sample) | 5.6% | 5.7% |
| Standard Deviation (Population) | 5.6% | 5.7% |
Demographics Similar to Immigrants from St. Vincent and the Grenadines and Immigrants from Trinidad and Tobago by GED/Equivalency
In terms of ged/equivalency, the demographic groups most similar to Immigrants from St. Vincent and the Grenadines are Paiute (82.0%, a difference of 0.030%), British West Indian (82.0%, a difference of 0.030%), Cuban (82.0%, a difference of 0.070%), Haitian (82.1%, a difference of 0.090%), and Immigrants from Cambodia (82.2%, a difference of 0.29%). Similarly, the demographic groups most similar to Immigrants from Trinidad and Tobago are Seminole (82.8%, a difference of 0.060%), Black/African American (82.8%, a difference of 0.080%), Arapaho (82.8%, a difference of 0.10%), Immigrants from Laos (82.7%, a difference of 0.13%), and Immigrants from Fiji (82.7%, a difference of 0.14%).
| Demographics | Rating | Rank | GED/Equivalency |
| Immigrants | Trinidad and Tobago | 0.1 /100 | #274 | Tragic 82.8% |
| Seminole | 0.1 /100 | #275 | Tragic 82.8% |
| Blacks/African Americans | 0.1 /100 | #276 | Tragic 82.8% |
| Arapaho | 0.1 /100 | #277 | Tragic 82.8% |
| Immigrants | Laos | 0.1 /100 | #278 | Tragic 82.7% |
| Immigrants | Fiji | 0.1 /100 | #279 | Tragic 82.7% |
| Cheyenne | 0.1 /100 | #280 | Tragic 82.7% |
| Sioux | 0.1 /100 | #281 | Tragic 82.6% |
| Immigrants | Immigrants | 0.1 /100 | #282 | Tragic 82.6% |
| Indonesians | 0.1 /100 | #283 | Tragic 82.5% |
| Immigrants | Barbados | 0.1 /100 | #284 | Tragic 82.4% |
| Cajuns | 0.0 /100 | #285 | Tragic 82.4% |
| Immigrants | West Indies | 0.0 /100 | #286 | Tragic 82.4% |
| Japanese | 0.0 /100 | #287 | Tragic 82.4% |
| Pueblo | 0.0 /100 | #288 | Tragic 82.3% |
| Immigrants | Cambodia | 0.0 /100 | #289 | Tragic 82.2% |
| Haitians | 0.0 /100 | #290 | Tragic 82.1% |
| Cubans | 0.0 /100 | #291 | Tragic 82.0% |
| Paiute | 0.0 /100 | #292 | Tragic 82.0% |
| British West Indians | 0.0 /100 | #293 | Tragic 82.0% |
| Immigrants | St. Vincent and the Grenadines | 0.0 /100 | #294 | Tragic 82.0% |