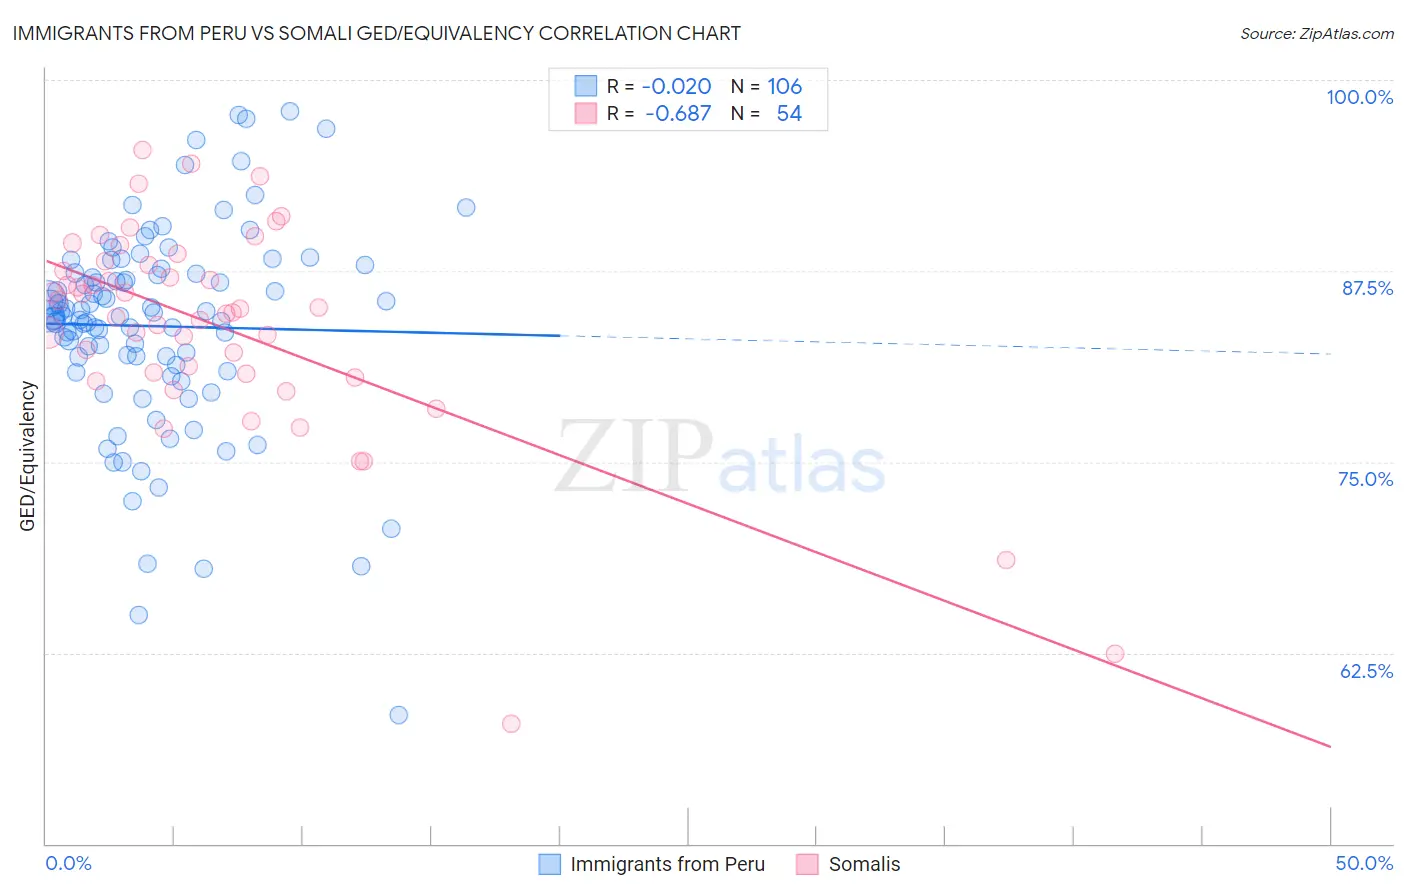
Immigrants from Peru vs Somali GED/Equivalency
COMPARE
Immigrants from Peru
Somali
GED/Equivalency
GED/Equivalency Comparison
Immigrants from Peru
Somalis
84.2%
GED/EQUIVALENCY
2.7/ 100
METRIC RATING
238th/ 347
METRIC RANK
85.0%
GED/EQUIVALENCY
16.4/ 100
METRIC RATING
199th/ 347
METRIC RANK
Immigrants from Peru vs Somali GED/Equivalency Correlation Chart
The statistical analysis conducted on geographies consisting of 328,860,880 people shows no correlation between the proportion of Immigrants from Peru and percentage of population with at least ged/equivalency education in the United States with a correlation coefficient (R) of -0.020 and weighted average of 84.2%. Similarly, the statistical analysis conducted on geographies consisting of 99,332,457 people shows a significant negative correlation between the proportion of Somalis and percentage of population with at least ged/equivalency education in the United States with a correlation coefficient (R) of -0.687 and weighted average of 85.0%, a difference of 1.0%.
GED/Equivalency Correlation Summary
| Measurement | Immigrants from Peru | Somali |
| Minimum | 58.5% | 57.9% |
| Maximum | 97.9% | 95.4% |
| Range | 39.5% | 37.5% |
| Mean | 83.9% | 83.8% |
| Median | 84.6% | 84.9% |
| Interquartile 25% (IQ1) | 81.3% | 80.8% |
| Interquartile 75% (IQ3) | 87.4% | 87.9% |
| Interquartile Range (IQR) | 6.1% | 7.1% |
| Standard Deviation (Sample) | 6.8% | 7.0% |
| Standard Deviation (Population) | 6.8% | 7.0% |
Similar Demographics by GED/Equivalency
Demographics Similar to Immigrants from Peru by GED/Equivalency
In terms of ged/equivalency, the demographic groups most similar to Immigrants from Peru are Immigrants from Bahamas (84.2%, a difference of 0.030%), Immigrants from South Eastern Asia (84.1%, a difference of 0.040%), Subsaharan African (84.2%, a difference of 0.060%), Ghanaian (84.3%, a difference of 0.13%), and Immigrants from Eritrea (84.3%, a difference of 0.13%).
| Demographics | Rating | Rank | GED/Equivalency |
| Immigrants | Middle Africa | 4.3 /100 | #231 | Tragic 84.4% |
| Immigrants | South America | 4.2 /100 | #232 | Tragic 84.4% |
| Immigrants | Panama | 4.1 /100 | #233 | Tragic 84.4% |
| Immigrants | Nigeria | 3.6 /100 | #234 | Tragic 84.3% |
| Ghanaians | 3.5 /100 | #235 | Tragic 84.3% |
| Immigrants | Eritrea | 3.5 /100 | #236 | Tragic 84.3% |
| Sub-Saharan Africans | 3.0 /100 | #237 | Tragic 84.2% |
| Immigrants | Peru | 2.7 /100 | #238 | Tragic 84.2% |
| Immigrants | Bahamas | 2.6 /100 | #239 | Tragic 84.2% |
| Immigrants | South Eastern Asia | 2.5 /100 | #240 | Tragic 84.1% |
| Senegalese | 1.9 /100 | #241 | Tragic 84.0% |
| Sri Lankans | 1.9 /100 | #242 | Tragic 84.0% |
| Cherokee | 1.3 /100 | #243 | Tragic 83.9% |
| Immigrants | Ghana | 1.3 /100 | #244 | Tragic 83.9% |
| Immigrants | Senegal | 1.2 /100 | #245 | Tragic 83.8% |
Demographics Similar to Somalis by GED/Equivalency
In terms of ged/equivalency, the demographic groups most similar to Somalis are Uruguayan (85.0%, a difference of 0.010%), Portuguese (85.0%, a difference of 0.020%), Cree (85.0%, a difference of 0.020%), Immigrants from Africa (85.1%, a difference of 0.040%), and Panamanian (85.0%, a difference of 0.040%).
| Demographics | Rating | Rank | GED/Equivalency |
| Immigrants | Nonimmigrants | 22.7 /100 | #192 | Fair 85.2% |
| Delaware | 22.2 /100 | #193 | Fair 85.2% |
| Puget Sound Salish | 20.8 /100 | #194 | Fair 85.2% |
| Chippewa | 20.8 /100 | #195 | Fair 85.2% |
| Tongans | 20.7 /100 | #196 | Fair 85.2% |
| Costa Ricans | 20.4 /100 | #197 | Fair 85.2% |
| Immigrants | Africa | 17.5 /100 | #198 | Poor 85.1% |
| Somalis | 16.4 /100 | #199 | Poor 85.0% |
| Uruguayans | 16.0 /100 | #200 | Poor 85.0% |
| Portuguese | 15.9 /100 | #201 | Poor 85.0% |
| Cree | 15.9 /100 | #202 | Poor 85.0% |
| Panamanians | 15.3 /100 | #203 | Poor 85.0% |
| Hawaiians | 15.2 /100 | #204 | Poor 85.0% |
| Liberians | 14.6 /100 | #205 | Poor 85.0% |
| Samoans | 13.7 /100 | #206 | Poor 84.9% |