German vs Alaska Native College, 1 year or more
COMPARE
German
Alaska Native
College, 1 year or more
College, 1 year or more Comparison
Germans
Alaska Natives
58.9%
COLLEGE, 1 YEAR OR MORE
34.7/ 100
METRIC RATING
187th/ 347
METRIC RANK
53.4%
COLLEGE, 1 YEAR OR MORE
0.0/ 100
METRIC RATING
288th/ 347
METRIC RANK
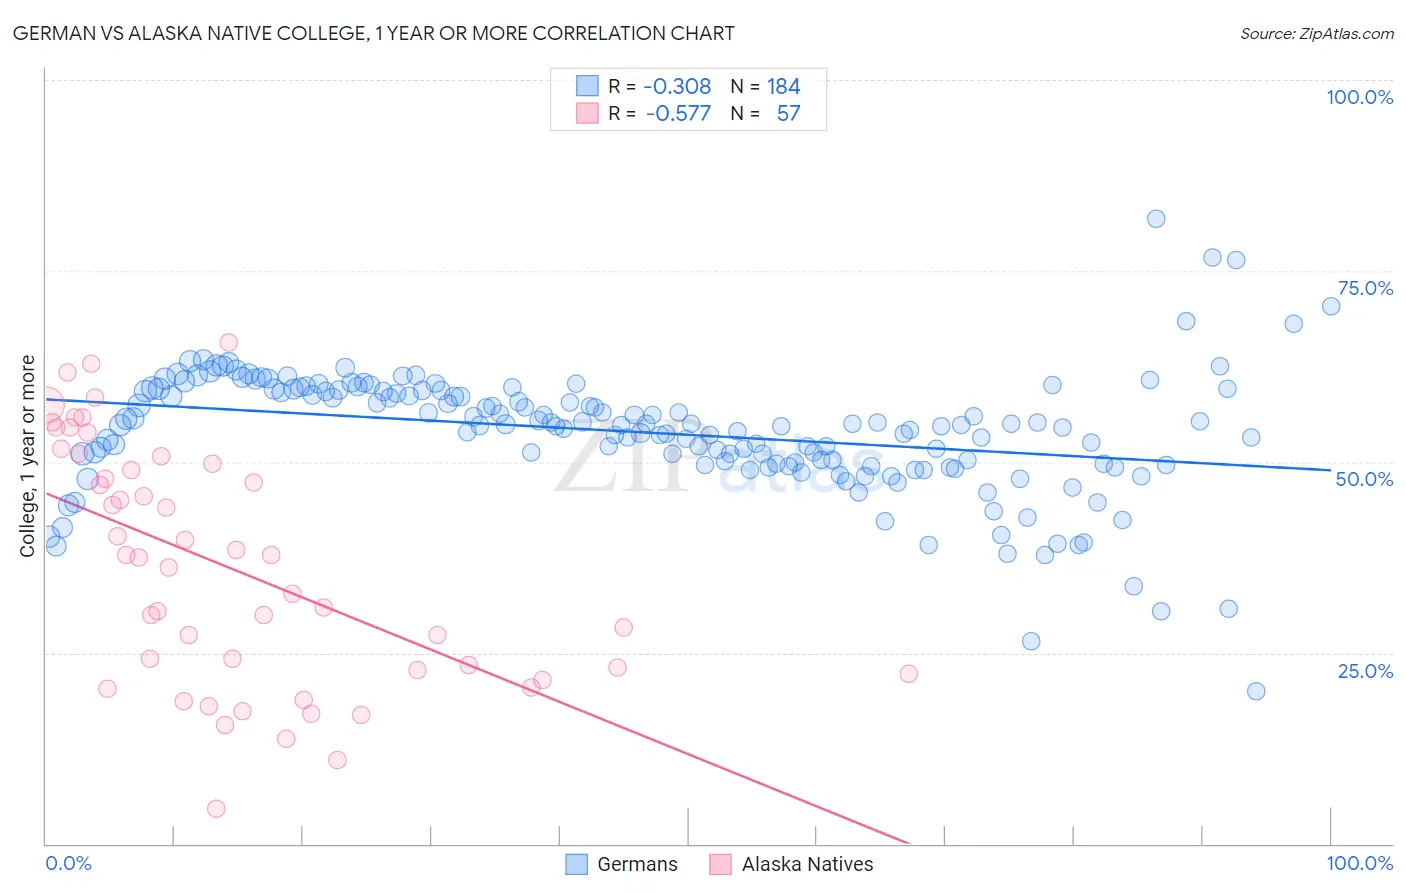
German vs Alaska Native College, 1 year or more Correlation Chart
The statistical analysis conducted on geographies consisting of 581,271,731 people shows a mild negative correlation between the proportion of Germans and percentage of population with at least college, 1 year or more education in the United States with a correlation coefficient (R) of -0.308 and weighted average of 58.9%. Similarly, the statistical analysis conducted on geographies consisting of 76,778,531 people shows a substantial negative correlation between the proportion of Alaska Natives and percentage of population with at least college, 1 year or more education in the United States with a correlation coefficient (R) of -0.577 and weighted average of 53.4%, a difference of 10.3%.
College, 1 year or more Correlation Summary
| Measurement | German | Alaska Native |
| Minimum | 20.0% | 4.6% |
| Maximum | 81.8% | 65.6% |
| Range | 61.8% | 61.0% |
| Mean | 53.9% | 36.3% |
| Median | 54.9% | 37.5% |
| Interquartile 25% (IQ1) | 49.8% | 22.5% |
| Interquartile 75% (IQ3) | 59.4% | 50.3% |
| Interquartile Range (IQR) | 9.6% | 27.8% |
| Standard Deviation (Sample) | 8.2% | 15.6% |
| Standard Deviation (Population) | 8.1% | 15.5% |
Similar Demographics by College, 1 year or more
Demographics Similar to Germans by College, 1 year or more
In terms of college, 1 year or more, the demographic groups most similar to Germans are Scotch-Irish (58.9%, a difference of 0.0%), French (58.9%, a difference of 0.020%), South American (59.0%, a difference of 0.070%), Uruguayan (58.8%, a difference of 0.17%), and Spaniard (59.0%, a difference of 0.21%).
| Demographics | Rating | Rank | College, 1 year or more |
| Yugoslavians | 44.1 /100 | #180 | Average 59.2% |
| Swiss | 43.4 /100 | #181 | Average 59.2% |
| Immigrants | Bosnia and Herzegovina | 42.8 /100 | #182 | Average 59.2% |
| German Russians | 39.3 /100 | #183 | Fair 59.1% |
| Spaniards | 38.3 /100 | #184 | Fair 59.0% |
| South Americans | 35.9 /100 | #185 | Fair 59.0% |
| Scotch-Irish | 34.7 /100 | #186 | Fair 58.9% |
| Germans | 34.7 /100 | #187 | Fair 58.9% |
| French | 34.4 /100 | #188 | Fair 58.9% |
| Uruguayans | 31.8 /100 | #189 | Fair 58.8% |
| Immigrants | Cameroon | 31.2 /100 | #190 | Fair 58.8% |
| Immigrants | Philippines | 29.2 /100 | #191 | Fair 58.7% |
| Colombians | 27.6 /100 | #192 | Fair 58.7% |
| Peruvians | 27.5 /100 | #193 | Fair 58.6% |
| Costa Ricans | 26.4 /100 | #194 | Fair 58.6% |
Demographics Similar to Alaska Natives by College, 1 year or more
In terms of college, 1 year or more, the demographic groups most similar to Alaska Natives are Immigrants from Ecuador (53.4%, a difference of 0.0%), Alaskan Athabascan (53.4%, a difference of 0.020%), Cuban (53.4%, a difference of 0.070%), Immigrants from Belize (53.5%, a difference of 0.17%), and Central American Indian (53.5%, a difference of 0.20%).
| Demographics | Rating | Rank | College, 1 year or more |
| Colville | 0.1 /100 | #281 | Tragic 54.1% |
| Guyanese | 0.1 /100 | #282 | Tragic 54.1% |
| Nicaraguans | 0.1 /100 | #283 | Tragic 53.9% |
| Ute | 0.1 /100 | #284 | Tragic 53.8% |
| Immigrants | Guyana | 0.1 /100 | #285 | Tragic 53.5% |
| Central American Indians | 0.1 /100 | #286 | Tragic 53.5% |
| Immigrants | Belize | 0.1 /100 | #287 | Tragic 53.5% |
| Alaska Natives | 0.0 /100 | #288 | Tragic 53.4% |
| Immigrants | Ecuador | 0.0 /100 | #289 | Tragic 53.4% |
| Alaskan Athabascans | 0.0 /100 | #290 | Tragic 53.4% |
| Cubans | 0.0 /100 | #291 | Tragic 53.4% |
| Chickasaw | 0.0 /100 | #292 | Tragic 53.3% |
| Blacks/African Americans | 0.0 /100 | #293 | Tragic 53.3% |
| Cherokee | 0.0 /100 | #294 | Tragic 53.2% |
| Yaqui | 0.0 /100 | #295 | Tragic 53.2% |