German vs Immigrants from Eastern Africa College, 1 year or more
COMPARE
German
Immigrants from Eastern Africa
College, 1 year or more
College, 1 year or more Comparison
Germans
Immigrants from Eastern Africa
58.9%
COLLEGE, 1 YEAR OR MORE
34.7/ 100
METRIC RATING
187th/ 347
METRIC RANK
61.2%
COLLEGE, 1 YEAR OR MORE
91.1/ 100
METRIC RATING
127th/ 347
METRIC RANK
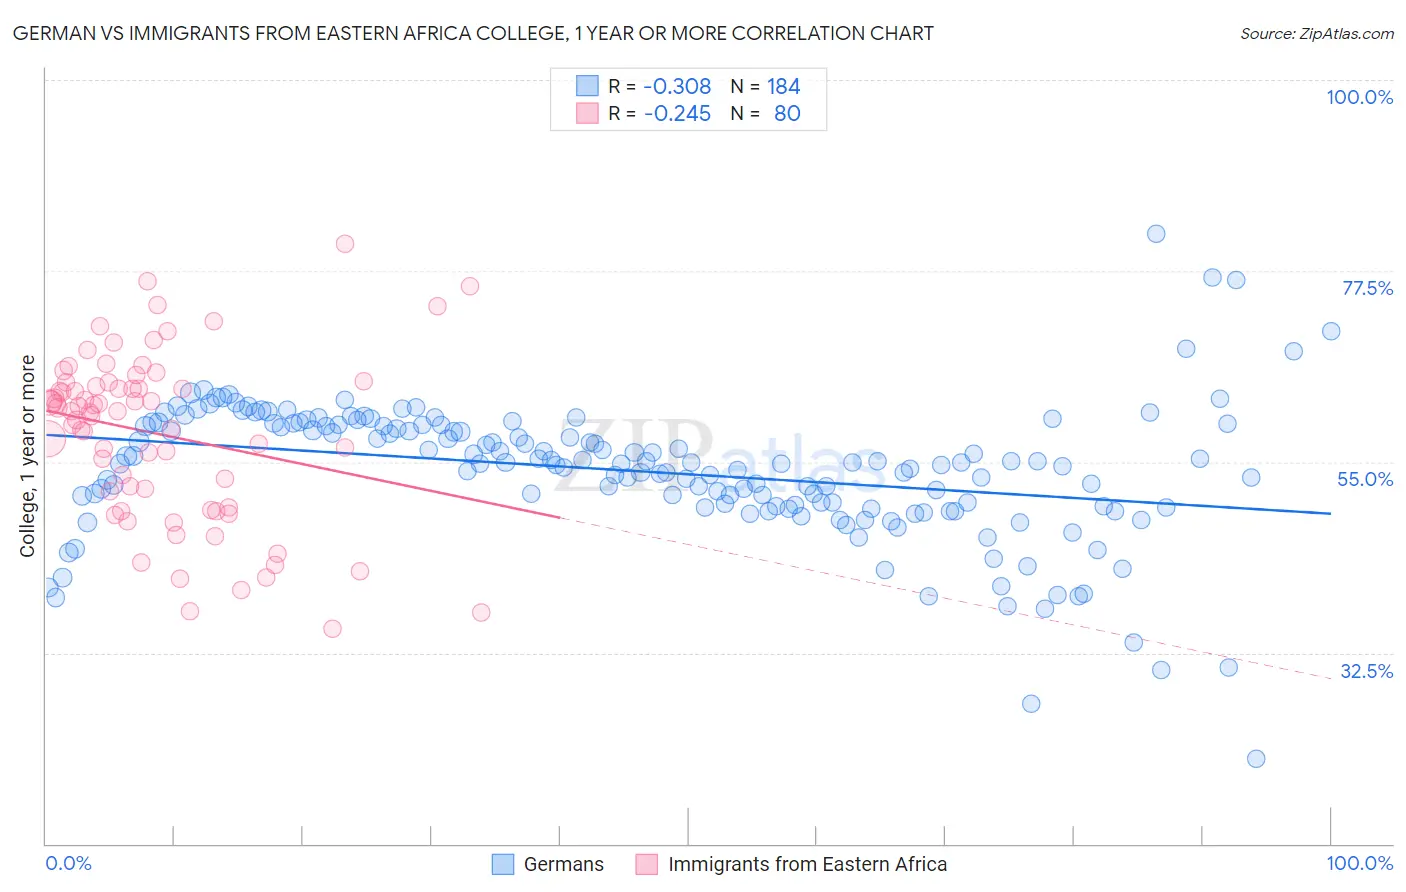
German vs Immigrants from Eastern Africa College, 1 year or more Correlation Chart
The statistical analysis conducted on geographies consisting of 581,271,731 people shows a mild negative correlation between the proportion of Germans and percentage of population with at least college, 1 year or more education in the United States with a correlation coefficient (R) of -0.308 and weighted average of 58.9%. Similarly, the statistical analysis conducted on geographies consisting of 355,150,445 people shows a weak negative correlation between the proportion of Immigrants from Eastern Africa and percentage of population with at least college, 1 year or more education in the United States with a correlation coefficient (R) of -0.245 and weighted average of 61.2%, a difference of 4.0%.
College, 1 year or more Correlation Summary
| Measurement | German | Immigrants from Eastern Africa |
| Minimum | 20.0% | 35.4% |
| Maximum | 81.8% | 80.7% |
| Range | 61.8% | 45.3% |
| Mean | 53.9% | 58.3% |
| Median | 54.9% | 60.9% |
| Interquartile 25% (IQ1) | 49.8% | 50.6% |
| Interquartile 75% (IQ3) | 59.4% | 64.1% |
| Interquartile Range (IQR) | 9.6% | 13.5% |
| Standard Deviation (Sample) | 8.2% | 9.9% |
| Standard Deviation (Population) | 8.1% | 9.8% |
Similar Demographics by College, 1 year or more
Demographics Similar to Germans by College, 1 year or more
In terms of college, 1 year or more, the demographic groups most similar to Germans are Scotch-Irish (58.9%, a difference of 0.0%), French (58.9%, a difference of 0.020%), South American (59.0%, a difference of 0.070%), Uruguayan (58.8%, a difference of 0.17%), and Spaniard (59.0%, a difference of 0.21%).
| Demographics | Rating | Rank | College, 1 year or more |
| Yugoslavians | 44.1 /100 | #180 | Average 59.2% |
| Swiss | 43.4 /100 | #181 | Average 59.2% |
| Immigrants | Bosnia and Herzegovina | 42.8 /100 | #182 | Average 59.2% |
| German Russians | 39.3 /100 | #183 | Fair 59.1% |
| Spaniards | 38.3 /100 | #184 | Fair 59.0% |
| South Americans | 35.9 /100 | #185 | Fair 59.0% |
| Scotch-Irish | 34.7 /100 | #186 | Fair 58.9% |
| Germans | 34.7 /100 | #187 | Fair 58.9% |
| French | 34.4 /100 | #188 | Fair 58.9% |
| Uruguayans | 31.8 /100 | #189 | Fair 58.8% |
| Immigrants | Cameroon | 31.2 /100 | #190 | Fair 58.8% |
| Immigrants | Philippines | 29.2 /100 | #191 | Fair 58.7% |
| Colombians | 27.6 /100 | #192 | Fair 58.7% |
| Peruvians | 27.5 /100 | #193 | Fair 58.6% |
| Costa Ricans | 26.4 /100 | #194 | Fair 58.6% |
Demographics Similar to Immigrants from Eastern Africa by College, 1 year or more
In terms of college, 1 year or more, the demographic groups most similar to Immigrants from Eastern Africa are Immigrants from Italy (61.2%, a difference of 0.0%), Alsatian (61.3%, a difference of 0.030%), Immigrants from Syria (61.3%, a difference of 0.070%), Ugandan (61.2%, a difference of 0.070%), and Venezuelan (61.3%, a difference of 0.15%).
| Demographics | Rating | Rank | College, 1 year or more |
| Pakistanis | 93.2 /100 | #120 | Exceptional 61.5% |
| Immigrants | Jordan | 92.7 /100 | #121 | Exceptional 61.4% |
| Immigrants | Chile | 92.3 /100 | #122 | Exceptional 61.4% |
| Serbians | 92.2 /100 | #123 | Exceptional 61.4% |
| Venezuelans | 92.1 /100 | #124 | Exceptional 61.3% |
| Immigrants | Syria | 91.6 /100 | #125 | Exceptional 61.3% |
| Alsatians | 91.3 /100 | #126 | Exceptional 61.3% |
| Immigrants | Eastern Africa | 91.1 /100 | #127 | Exceptional 61.2% |
| Immigrants | Italy | 91.1 /100 | #128 | Exceptional 61.2% |
| Ugandans | 90.7 /100 | #129 | Exceptional 61.2% |
| Italians | 89.5 /100 | #130 | Excellent 61.1% |
| Immigrants | Morocco | 89.5 /100 | #131 | Excellent 61.1% |
| Scandinavians | 88.2 /100 | #132 | Excellent 61.0% |
| Immigrants | Uzbekistan | 88.0 /100 | #133 | Excellent 61.0% |
| Immigrants | Venezuela | 87.9 /100 | #134 | Excellent 61.0% |