French American Indian vs Scandinavian College, Under 1 year
COMPARE
French American Indian
Scandinavian
College, Under 1 year
College, Under 1 year Comparison
French American Indians
Scandinavians
62.4%
COLLEGE, UNDER 1 YEAR
1.5/ 100
METRIC RATING
238th/ 347
METRIC RANK
67.7%
COLLEGE, UNDER 1 YEAR
95.8/ 100
METRIC RATING
109th/ 347
METRIC RANK
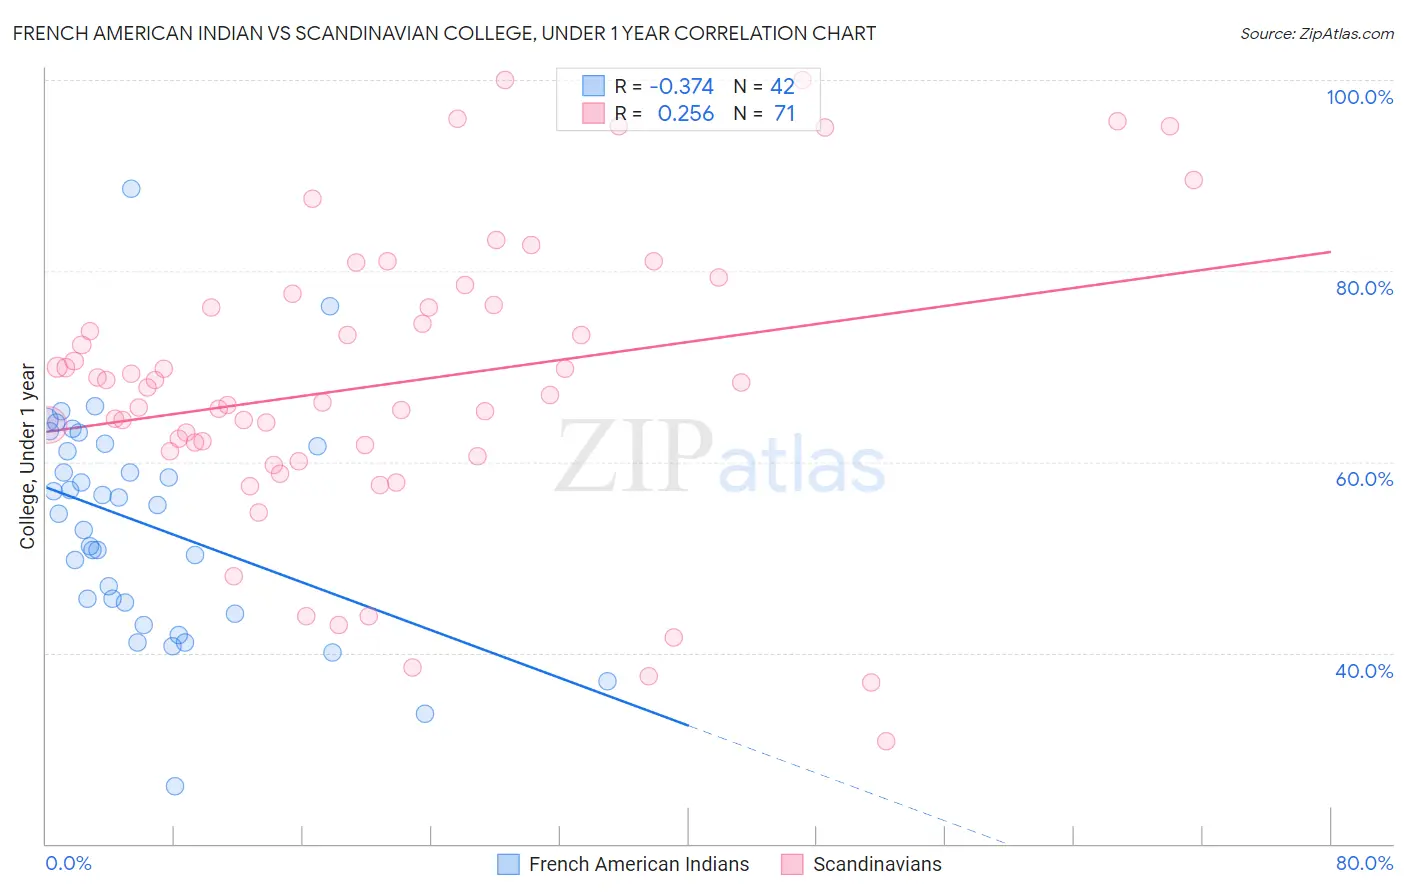
French American Indian vs Scandinavian College, Under 1 year Correlation Chart
The statistical analysis conducted on geographies consisting of 131,976,089 people shows a mild negative correlation between the proportion of French American Indians and percentage of population with at least college, under 1 year education in the United States with a correlation coefficient (R) of -0.374 and weighted average of 62.4%. Similarly, the statistical analysis conducted on geographies consisting of 472,657,876 people shows a weak positive correlation between the proportion of Scandinavians and percentage of population with at least college, under 1 year education in the United States with a correlation coefficient (R) of 0.256 and weighted average of 67.7%, a difference of 8.4%.
College, Under 1 year Correlation Summary
| Measurement | French American Indian | Scandinavian |
| Minimum | 26.1% | 30.8% |
| Maximum | 88.6% | 100.0% |
| Range | 62.5% | 69.2% |
| Mean | 53.5% | 68.2% |
| Median | 55.0% | 67.8% |
| Interquartile 25% (IQ1) | 45.3% | 61.1% |
| Interquartile 75% (IQ3) | 61.6% | 76.4% |
| Interquartile Range (IQR) | 16.3% | 15.3% |
| Standard Deviation (Sample) | 11.7% | 15.3% |
| Standard Deviation (Population) | 11.5% | 15.2% |
Similar Demographics by College, Under 1 year
Demographics Similar to French American Indians by College, Under 1 year
In terms of college, under 1 year, the demographic groups most similar to French American Indians are Immigrants from Burma/Myanmar (62.5%, a difference of 0.090%), Immigrants (62.5%, a difference of 0.12%), Spanish American (62.6%, a difference of 0.25%), Chippewa (62.6%, a difference of 0.30%), and Iroquois (62.6%, a difference of 0.33%).
| Demographics | Rating | Rank | College, Under 1 year |
| Immigrants | Western Africa | 2.4 /100 | #231 | Tragic 62.8% |
| Osage | 2.2 /100 | #232 | Tragic 62.7% |
| Iroquois | 2.0 /100 | #233 | Tragic 62.6% |
| Chippewa | 2.0 /100 | #234 | Tragic 62.6% |
| Spanish Americans | 1.9 /100 | #235 | Tragic 62.6% |
| Immigrants | Immigrants | 1.7 /100 | #236 | Tragic 62.5% |
| Immigrants | Burma/Myanmar | 1.6 /100 | #237 | Tragic 62.5% |
| French American Indians | 1.5 /100 | #238 | Tragic 62.4% |
| Nepalese | 1.1 /100 | #239 | Tragic 62.2% |
| Aleuts | 1.1 /100 | #240 | Tragic 62.2% |
| Ottawa | 1.1 /100 | #241 | Tragic 62.2% |
| Malaysians | 1.1 /100 | #242 | Tragic 62.2% |
| Hawaiians | 1.1 /100 | #243 | Tragic 62.1% |
| Colville | 1.0 /100 | #244 | Tragic 62.1% |
| Delaware | 0.9 /100 | #245 | Tragic 62.1% |
Demographics Similar to Scandinavians by College, Under 1 year
In terms of college, under 1 year, the demographic groups most similar to Scandinavians are Assyrian/Chaldean/Syriac (67.7%, a difference of 0.0%), Ukrainian (67.7%, a difference of 0.0%), Macedonian (67.6%, a difference of 0.020%), Syrian (67.6%, a difference of 0.050%), and Immigrants from Egypt (67.7%, a difference of 0.060%).
| Demographics | Rating | Rank | College, Under 1 year |
| Palestinians | 96.9 /100 | #102 | Exceptional 67.9% |
| Carpatho Rusyns | 96.8 /100 | #103 | Exceptional 67.9% |
| Immigrants | Western Asia | 96.6 /100 | #104 | Exceptional 67.8% |
| Afghans | 96.6 /100 | #105 | Exceptional 67.8% |
| Immigrants | Croatia | 96.6 /100 | #106 | Exceptional 67.8% |
| Austrians | 96.4 /100 | #107 | Exceptional 67.8% |
| Immigrants | Egypt | 96.0 /100 | #108 | Exceptional 67.7% |
| Scandinavians | 95.8 /100 | #109 | Exceptional 67.7% |
| Assyrians/Chaldeans/Syriacs | 95.8 /100 | #110 | Exceptional 67.7% |
| Ukrainians | 95.8 /100 | #111 | Exceptional 67.7% |
| Macedonians | 95.7 /100 | #112 | Exceptional 67.6% |
| Syrians | 95.6 /100 | #113 | Exceptional 67.6% |
| Chileans | 95.3 /100 | #114 | Exceptional 67.6% |
| Basques | 95.2 /100 | #115 | Exceptional 67.6% |
| Immigrants | Nepal | 94.9 /100 | #116 | Exceptional 67.5% |