Ethiopian vs Panamanian College, Under 1 year

COMPARE

Ethiopian
Race
Ancestry
AfghanAfricanAlaska NativeAlaskan AthabascanAlbanianAleutAlsatianAmericanApacheArabArapahoArgentineanArmenianAssyrian/Chaldean/SyriacAustralianAustrianBahamianBangladeshiBarbadianBasqueBelgianBelizeanBermudanBhutaneseBlackfeetBolivianBrazilianBritishBritish West IndianBulgarianBurmeseCajunCambodianCanadianCape VerdeanCarpatho RusynCelticCentral AmericanCentral American IndianCherokeeCheyenneChickasawChileanChineseChippewaChoctawColombianColvilleComancheCosta RicanCreeCreekCroatianCrowCubanCypriotCzechCzechoslovakianDanishDelawareDominicanDutchDutch West IndianEastern EuropeanEcuadorianEgyptianEnglishEstonianEthiopianEuropeanFijianFilipinoFinnishFrenchFrench American IndianFrench CanadianGermanGerman RussianGhanaianGreekGuamanian/ChamorroGuatemalanGuyaneseHaitianHmongHonduranHopiHoumaHungarianIcelanderIndian (Asian)IndonesianInupiatIranianIraqiIrishIroquoisIsraeliItalianJamaicanJapaneseJordanianKenyanKiowaKoreanLaotianLatvianLebaneseLiberianLithuanianLumbeeLuxembourgerMacedonianMalaysianMalteseMarshalleseMenomineeMexicanMexican American IndianMongolianMoroccanNative HawaiianNavajoNepaleseNew ZealanderNicaraguanNigerianNorthern EuropeanNorwegianOkinawanOsageOttawaPaiutePakistaniPalestinianParaguayanPennsylvania GermanPeruvianPimaPolishPortuguesePotawatomiPuebloPuerto RicanPuget Sound SalishRomanianRussianSalvadoranSamoanScandinavianScotch-IrishScottishSeminoleSenegaleseSerbianShoshoneSierra LeoneanSiouxSlavicSlovakSloveneSomaliSouth AfricanSouth AmericanSouth American IndianSoviet UnionSpaniardSpanishSpanish AmericanSpanish American IndianSri LankanSubsaharan AfricanSudaneseSwedishSwissSyrianTaiwaneseThaiTlingit-HaidaTohono O'OdhamTonganTrinidadian and TobagonianTsimshianTurkishU.S. Virgin IslanderUgandanUkrainianUruguayanUteVenezuelanVietnameseWelshWest IndianYakamaYaquiYugoslavianYumanYup'ikZimbabwean
Immigration
NonimmigrantsImmigrantsAfghanistanAfricaAlbaniaArgentinaArmeniaAsiaAustraliaAustriaBahamasBangladeshBarbadosBelarusBelgiumBelizeBoliviaBosnia and HerzegovinaBrazilBulgariaBurma/MyanmarCabo VerdeCambodiaCameroonCanadaCaribbeanCentral AmericaChileChinaColombiaCongoCosta RicaCroatiaCubaCzechoslovakiaDenmarkDominicaDominican RepublicEastern AfricaEastern AsiaEastern EuropeEcuadorEgyptEl SalvadorEnglandEritreaEthiopiaEuropeFijiFranceGermanyGhanaGreeceGrenadaGuatemalaGuyanaHaitiHondurasHong KongHungaryIndiaIndonesiaIranIraqIrelandIsraelItalyJamaicaJapanJordanKazakhstanKenyaKoreaKuwaitLaosLatin AmericaLatviaLebanonLiberiaLithuaniaMalaysiaMexicoMicronesiaMiddle AfricaMoldovaMoroccoNepalNetherlandsNicaraguaNigeriaNorth AmericaNorth MacedoniaNorthern AfricaNorthern EuropeNorwayOceaniaPakistanPanamaPeruPhilippinesPolandPortugalRomaniaRussiaSaudi ArabiaScotlandSenegalSerbiaSierra LeoneSingaporeSomaliaSouth AfricaSouth AmericaSouth Central AsiaSouth Eastern AsiaSouthern EuropeSpainSri LankaSt. Vincent and the GrenadinesSudanSwedenSwitzerlandSyriaTaiwanThailandTrinidad and TobagoTurkeyUgandaUkraineUruguayUzbekistanVenezuelaVietnamWest IndiesWestern AfricaWestern AsiaWestern EuropeYemenZaireZimbabweAzores
Panamanian
Race
Ancestry
AfghanAfricanAlaska NativeAlaskan AthabascanAlbanianAleutAlsatianAmericanApacheArabArapahoArgentineanArmenianAssyrian/Chaldean/SyriacAustralianAustrianBahamianBangladeshiBarbadianBasqueBelgianBelizeanBermudanBhutaneseBlackfeetBolivianBrazilianBritishBritish West IndianBulgarianBurmeseCajunCambodianCanadianCape VerdeanCarpatho RusynCelticCentral AmericanCentral American IndianCherokeeCheyenneChickasawChileanChineseChippewaChoctawColombianColvilleComancheCosta RicanCreeCreekCroatianCrowCubanCypriotCzechCzechoslovakianDanishDelawareDominicanDutchDutch West IndianEastern EuropeanEcuadorianEgyptianEnglishEstonianEuropeanFijianFilipinoFinnishFrenchFrench American IndianFrench CanadianGermanGerman RussianGhanaianGreekGuamanian/ChamorroGuatemalanGuyaneseHaitianHmongHonduranHopiHoumaHungarianIcelanderIndian (Asian)IndonesianInupiatIranianIraqiIrishIroquoisIsraeliItalianJamaicanJapaneseJordanianKenyanKiowaKoreanLaotianLatvianLebaneseLiberianLithuanianLumbeeLuxembourgerMacedonianMalaysianMalteseMarshalleseMenomineeMexicanMexican American IndianMongolianMoroccanNative HawaiianNavajoNepaleseNew ZealanderNicaraguanNigerianNorthern EuropeanNorwegianOkinawanOsageOttawaPaiutePakistaniPalestinianPanamanianParaguayanPennsylvania GermanPeruvianPimaPolishPortuguesePotawatomiPuebloPuerto RicanPuget Sound SalishRomanianRussianSalvadoranSamoanScandinavianScotch-IrishScottishSeminoleSenegaleseSerbianShoshoneSierra LeoneanSiouxSlavicSlovakSloveneSomaliSouth AfricanSouth AmericanSouth American IndianSoviet UnionSpaniardSpanishSpanish AmericanSpanish American IndianSri LankanSubsaharan AfricanSudaneseSwedishSwissSyrianTaiwaneseThaiTlingit-HaidaTohono O'OdhamTonganTrinidadian and TobagonianTsimshianTurkishU.S. Virgin IslanderUgandanUkrainianUruguayanUteVenezuelanVietnameseWelshWest IndianYakamaYaquiYugoslavianYumanYup'ikZimbabwean
Immigration
NonimmigrantsImmigrantsAfghanistanAfricaAlbaniaArgentinaArmeniaAsiaAustraliaAustriaBahamasBangladeshBarbadosBelarusBelgiumBelizeBoliviaBosnia and HerzegovinaBrazilBulgariaBurma/MyanmarCabo VerdeCambodiaCameroonCanadaCaribbeanCentral AmericaChileChinaColombiaCongoCosta RicaCroatiaCubaCzechoslovakiaDenmarkDominicaDominican RepublicEastern AfricaEastern AsiaEastern EuropeEcuadorEgyptEl SalvadorEnglandEritreaEthiopiaEuropeFijiFranceGermanyGhanaGreeceGrenadaGuatemalaGuyanaHaitiHondurasHong KongHungaryIndiaIndonesiaIranIraqIrelandIsraelItalyJamaicaJapanJordanKazakhstanKenyaKoreaKuwaitLaosLatin AmericaLatviaLebanonLiberiaLithuaniaMalaysiaMexicoMicronesiaMiddle AfricaMoldovaMoroccoNepalNetherlandsNicaraguaNigeriaNorth AmericaNorth MacedoniaNorthern AfricaNorthern EuropeNorwayOceaniaPakistanPanamaPeruPhilippinesPolandPortugalRomaniaRussiaSaudi ArabiaScotlandSenegalSerbiaSierra LeoneSingaporeSomaliaSouth AfricaSouth AmericaSouth Central AsiaSouth Eastern AsiaSouthern EuropeSpainSri LankaSt. Vincent and the GrenadinesSudanSwedenSwitzerlandSyriaTaiwanThailandTrinidad and TobagoTurkeyUgandaUkraineUruguayUzbekistanVenezuelaVietnamWest IndiesWestern AfricaWestern AsiaWestern EuropeYemenZaireZimbabweAzores
College, Under 1 year
Income
Poverty
Unemployment
Labor Participation
Family Structure
Vehicle Availability
Education Level
Disability

College, Under 1 year Comparison

Ethiopians

Panamanians

Exceptional
Poor
68.3%
COLLEGE, UNDER 1 YEAR
98.2/ 100
METRIC RATING
89th/ 347
METRIC RANK
64.3%
COLLEGE, UNDER 1 YEAR
17.0/ 100
METRIC RATING
199th/ 347
METRIC RANK

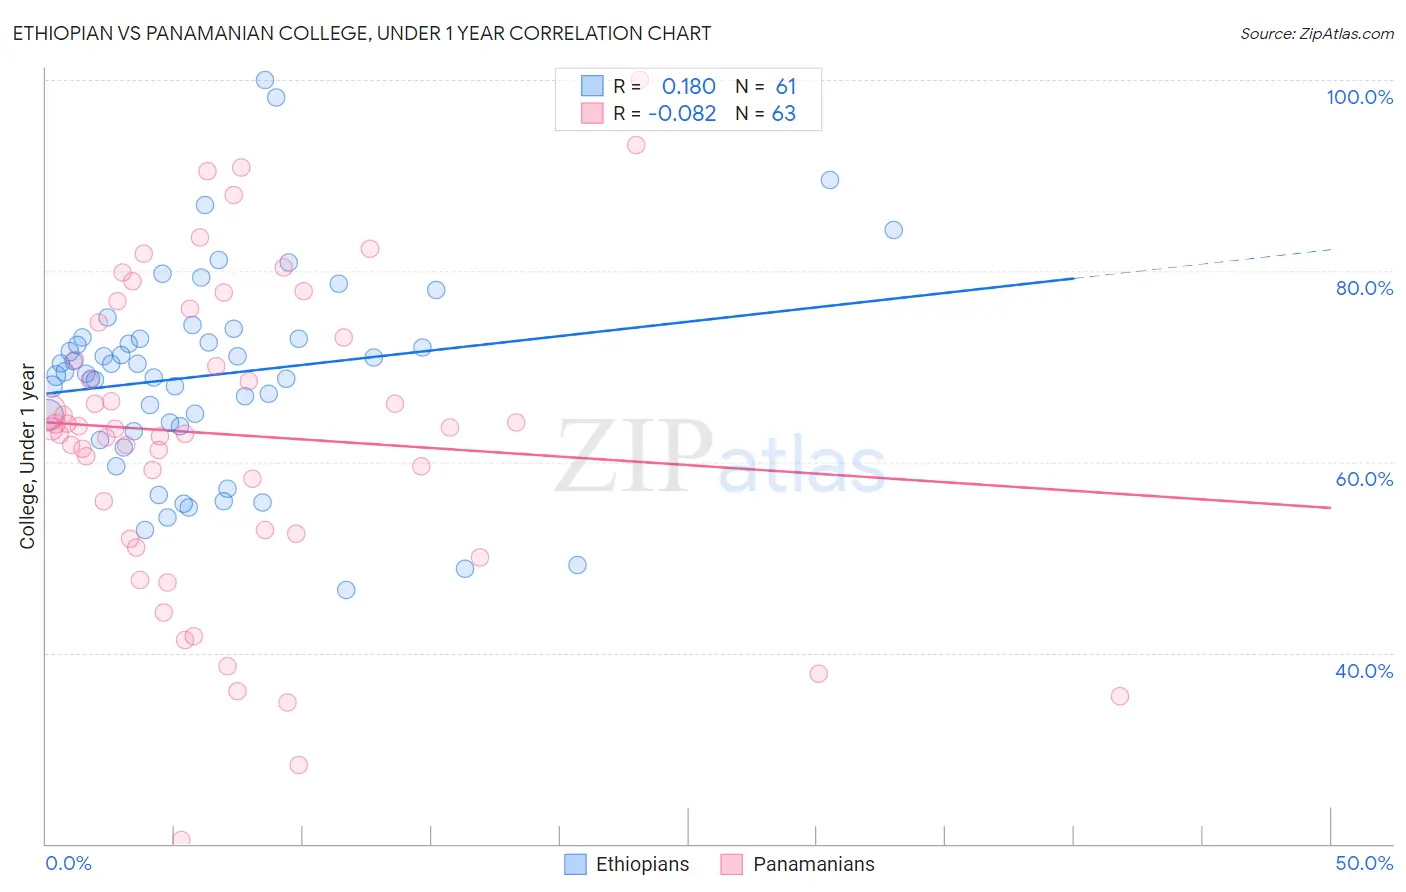
Ethiopian vs Panamanian College, Under 1 year Correlation Chart

The statistical analysis conducted on geographies consisting of 223,260,030 people shows a poor positive correlation between the proportion of Ethiopians and percentage of population with at least college, under 1 year education in the United States with a correlation coefficient (R) of 0.180 and weighted average of 68.3%. Similarly, the statistical analysis conducted on geographies consisting of 281,250,786 people shows a slight negative correlation between the proportion of Panamanians and percentage of population with at least college, under 1 year education in the United States with a correlation coefficient (R) of -0.082 and weighted average of 64.3%, a difference of 6.3%.
Ethiopian vs Panamanian College, Under 1 year

College, Under 1 year Correlation Summary

MeasurementEthiopianPanamanian
Minimum46.6%20.4%
Maximum100.0%100.0%
Range53.4%79.6%
Mean69.1%62.9%
Median69.4%63.5%
Interquartile 25% (IQ1)63.5%52.5%
Interquartile 75% (IQ3)73.0%74.6%
Interquartile Range (IQR)9.5%22.0%
Standard Deviation (Sample)10.6%16.4%
Standard Deviation (Population)10.6%16.3%

Similar Demographics by College, Under 1 year

Demographics Similar to Ethiopians by College, Under 1 year

In terms of college, under 1 year, the demographic groups most similar to Ethiopians are Croatian (68.3%, a difference of 0.010%), Chinese (68.3%, a difference of 0.030%), Immigrants from Lebanon (68.3%, a difference of 0.050%), Immigrants from Hungary (68.3%, a difference of 0.060%), and Egyptian (68.3%, a difference of 0.060%).
DemographicsRating | RankCollege, Under 1 year
Norwegians
98.4
/100
|
#82
Exceptional
68.4%
Argentineans
98.4
/100
|
#83
Exceptional
68.4%
Immigrants | Hungary
98.3
/100
|
#84
Exceptional
68.3%
Egyptians
98.3
/100
|
#85
Exceptional
68.3%
Immigrants | Lebanon
98.3
/100
|
#86
Exceptional
68.3%
Chinese
98.3
/100
|
#87
Exceptional
68.3%
Croatians
98.2
/100
|
#88
Exceptional
68.3%
Ethiopians
98.2
/100
|
#89
Exceptional
68.3%
Icelanders
98.1
/100
|
#90
Exceptional
68.3%
Europeans
98.1
/100
|
#91
Exceptional
68.2%
Luxembourgers
98.1
/100
|
#92
Exceptional
68.2%
Romanians
97.9
/100
|
#93
Exceptional
68.2%
Armenians
97.7
/100
|
#94
Exceptional
68.1%
Immigrants | Pakistan
97.5
/100
|
#95
Exceptional
68.0%
Jordanians
97.4
/100
|
#96
Exceptional
68.0%

Demographics Similar to Panamanians by College, Under 1 year

In terms of college, under 1 year, the demographic groups most similar to Panamanians are Nigerian (64.3%, a difference of 0.020%), French Canadian (64.2%, a difference of 0.060%), Tsimshian (64.3%, a difference of 0.070%), South American (64.2%, a difference of 0.070%), and Uruguayan (64.2%, a difference of 0.11%).
DemographicsRating | RankCollege, Under 1 year
Immigrants | Thailand
27.0
/100
|
#192
Fair
64.7%
Slovaks
26.7
/100
|
#193
Fair
64.7%
Immigrants | Cameroon
24.6
/100
|
#194
Fair
64.6%
Immigrants | South Eastern Asia
22.1
/100
|
#195
Fair
64.5%
Tongans
21.2
/100
|
#196
Fair
64.5%
Costa Ricans
19.6
/100
|
#197
Poor
64.4%
Tsimshian
17.9
/100
|
#198
Poor
64.3%
Panamanians
17.0
/100
|
#199
Poor
64.3%
Nigerians
16.7
/100
|
#200
Poor
64.3%
French Canadians
16.3
/100
|
#201
Poor
64.2%
South Americans
16.2
/100
|
#202
Poor
64.2%
Uruguayans
15.6
/100
|
#203
Poor
64.2%
Immigrants | Zaire
14.6
/100
|
#204
Poor
64.1%
Peruvians
13.7
/100
|
#205
Poor
64.1%
Whites/Caucasians
12.8
/100
|
#206
Poor
64.0%