Pueblo vs Czechoslovakian Disability Age Under 5
COMPARE
Pueblo
Czechoslovakian
Disability Age Under 5
Disability Age Under 5 Comparison
Pueblo
Czechoslovakians
1.3%
DISABILITY AGE UNDER 5
3.8/ 100
METRIC RATING
234th/ 347
METRIC RANK
1.5%
DISABILITY AGE UNDER 5
0.0/ 100
METRIC RATING
281st/ 347
METRIC RANK
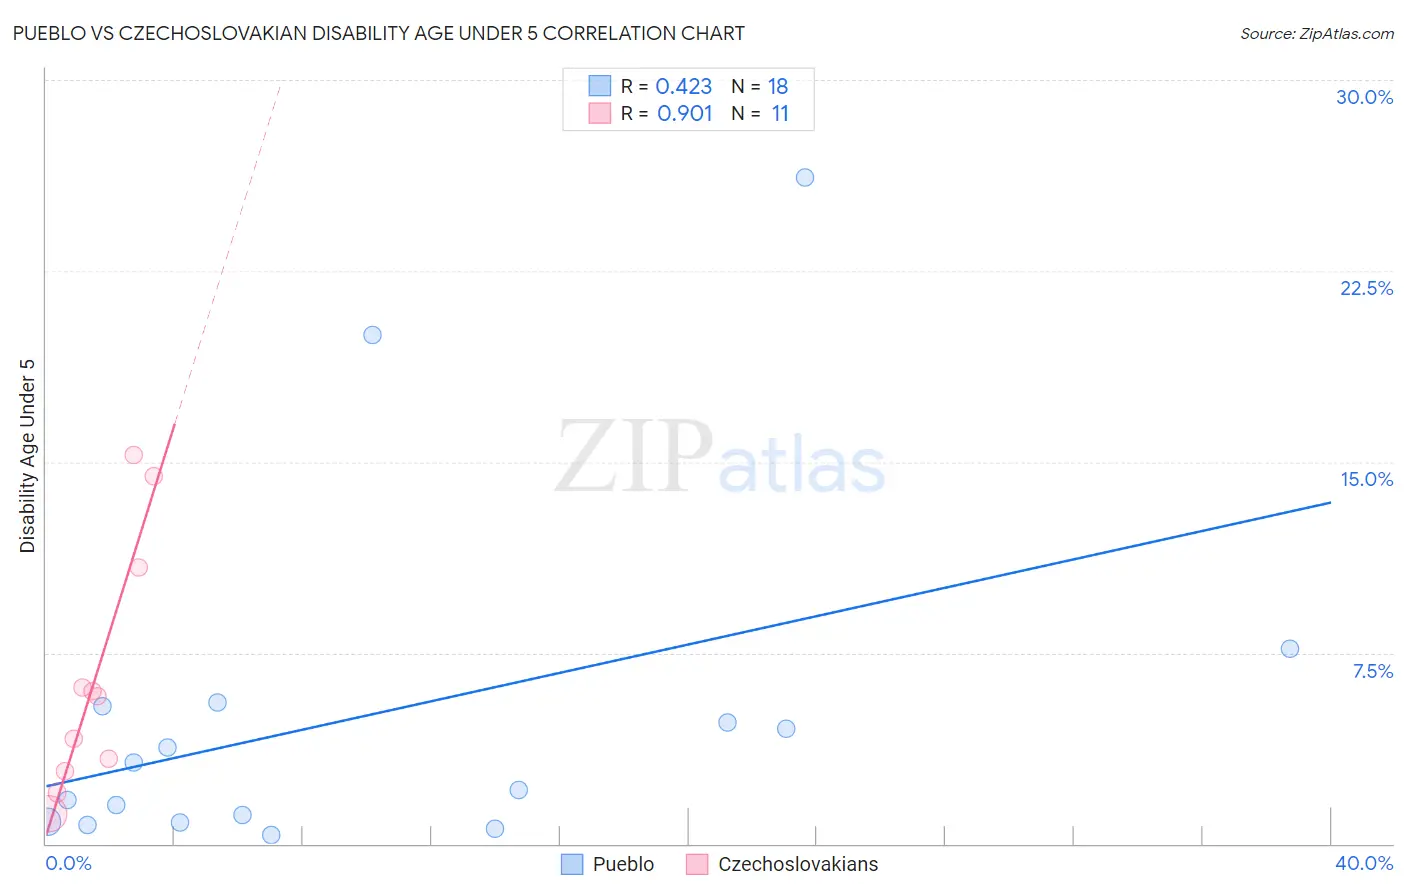
Pueblo vs Czechoslovakian Disability Age Under 5 Correlation Chart
The statistical analysis conducted on geographies consisting of 91,796,516 people shows a moderate positive correlation between the proportion of Pueblo and percentage of population with a disability under the age of 5 in the United States with a correlation coefficient (R) of 0.423 and weighted average of 1.3%. Similarly, the statistical analysis conducted on geographies consisting of 199,678,332 people shows a near-perfect positive correlation between the proportion of Czechoslovakians and percentage of population with a disability under the age of 5 in the United States with a correlation coefficient (R) of 0.901 and weighted average of 1.5%, a difference of 13.6%.
Disability Age Under 5 Correlation Summary
| Measurement | Pueblo | Czechoslovakian |
| Minimum | 0.37% | 1.2% |
| Maximum | 26.2% | 15.3% |
| Range | 25.8% | 14.1% |
| Mean | 5.1% | 6.5% |
| Median | 2.7% | 5.8% |
| Interquartile 25% (IQ1) | 0.86% | 2.8% |
| Interquartile 75% (IQ3) | 5.4% | 10.8% |
| Interquartile Range (IQR) | 4.5% | 8.0% |
| Standard Deviation (Sample) | 7.0% | 4.9% |
| Standard Deviation (Population) | 6.8% | 4.6% |
Similar Demographics by Disability Age Under 5
Demographics Similar to Pueblo by Disability Age Under 5
In terms of disability age under 5, the demographic groups most similar to Pueblo are Central American Indian (1.3%, a difference of 0.070%), Tongan (1.3%, a difference of 0.26%), South American Indian (1.3%, a difference of 0.27%), French American Indian (1.3%, a difference of 0.38%), and Immigrants from Northern Europe (1.3%, a difference of 0.51%).
| Demographics | Rating | Rank | Disability Age Under 5 |
| Taiwanese | 6.1 /100 | #227 | Tragic 1.3% |
| Luxembourgers | 6.1 /100 | #228 | Tragic 1.3% |
| Immigrants | Costa Rica | 5.5 /100 | #229 | Tragic 1.3% |
| Lebanese | 5.3 /100 | #230 | Tragic 1.3% |
| Immigrants | Northern Europe | 4.7 /100 | #231 | Tragic 1.3% |
| French American Indians | 4.5 /100 | #232 | Tragic 1.3% |
| Tongans | 4.2 /100 | #233 | Tragic 1.3% |
| Pueblo | 3.8 /100 | #234 | Tragic 1.3% |
| Central American Indians | 3.6 /100 | #235 | Tragic 1.3% |
| South American Indians | 3.3 /100 | #236 | Tragic 1.3% |
| Basques | 3.0 /100 | #237 | Tragic 1.3% |
| Spanish American Indians | 2.4 /100 | #238 | Tragic 1.3% |
| Immigrants | Austria | 2.3 /100 | #239 | Tragic 1.3% |
| Native Hawaiians | 2.2 /100 | #240 | Tragic 1.3% |
| Maltese | 2.2 /100 | #241 | Tragic 1.3% |
Demographics Similar to Czechoslovakians by Disability Age Under 5
In terms of disability age under 5, the demographic groups most similar to Czechoslovakians are Cheyenne (1.5%, a difference of 0.34%), Delaware (1.5%, a difference of 0.54%), European (1.5%, a difference of 0.59%), British (1.5%, a difference of 1.7%), and Croatian (1.5%, a difference of 1.8%).
| Demographics | Rating | Rank | Disability Age Under 5 |
| Iroquois | 0.0 /100 | #274 | Tragic 1.5% |
| Brazilians | 0.0 /100 | #275 | Tragic 1.5% |
| Greeks | 0.0 /100 | #276 | Tragic 1.5% |
| Canadians | 0.0 /100 | #277 | Tragic 1.5% |
| Kiowa | 0.0 /100 | #278 | Tragic 1.5% |
| Danes | 0.0 /100 | #279 | Tragic 1.5% |
| British | 0.0 /100 | #280 | Tragic 1.5% |
| Czechoslovakians | 0.0 /100 | #281 | Tragic 1.5% |
| Cheyenne | 0.0 /100 | #282 | Tragic 1.5% |
| Delaware | 0.0 /100 | #283 | Tragic 1.5% |
| Europeans | 0.0 /100 | #284 | Tragic 1.5% |
| Croatians | 0.0 /100 | #285 | Tragic 1.5% |
| Tlingit-Haida | 0.0 /100 | #286 | Tragic 1.5% |
| Scandinavians | 0.0 /100 | #287 | Tragic 1.5% |
| Estonians | 0.0 /100 | #288 | Tragic 1.5% |