Navajo vs Immigrants from Kuwait Disability
COMPARE
Navajo
Immigrants from Kuwait
Disability
Disability Comparison
Navajo
Immigrants from Kuwait
14.3%
DISABILITY
0.0/ 100
METRIC RATING
330th/ 347
METRIC RANK
10.7%
DISABILITY
100.0/ 100
METRIC RATING
33rd/ 347
METRIC RANK
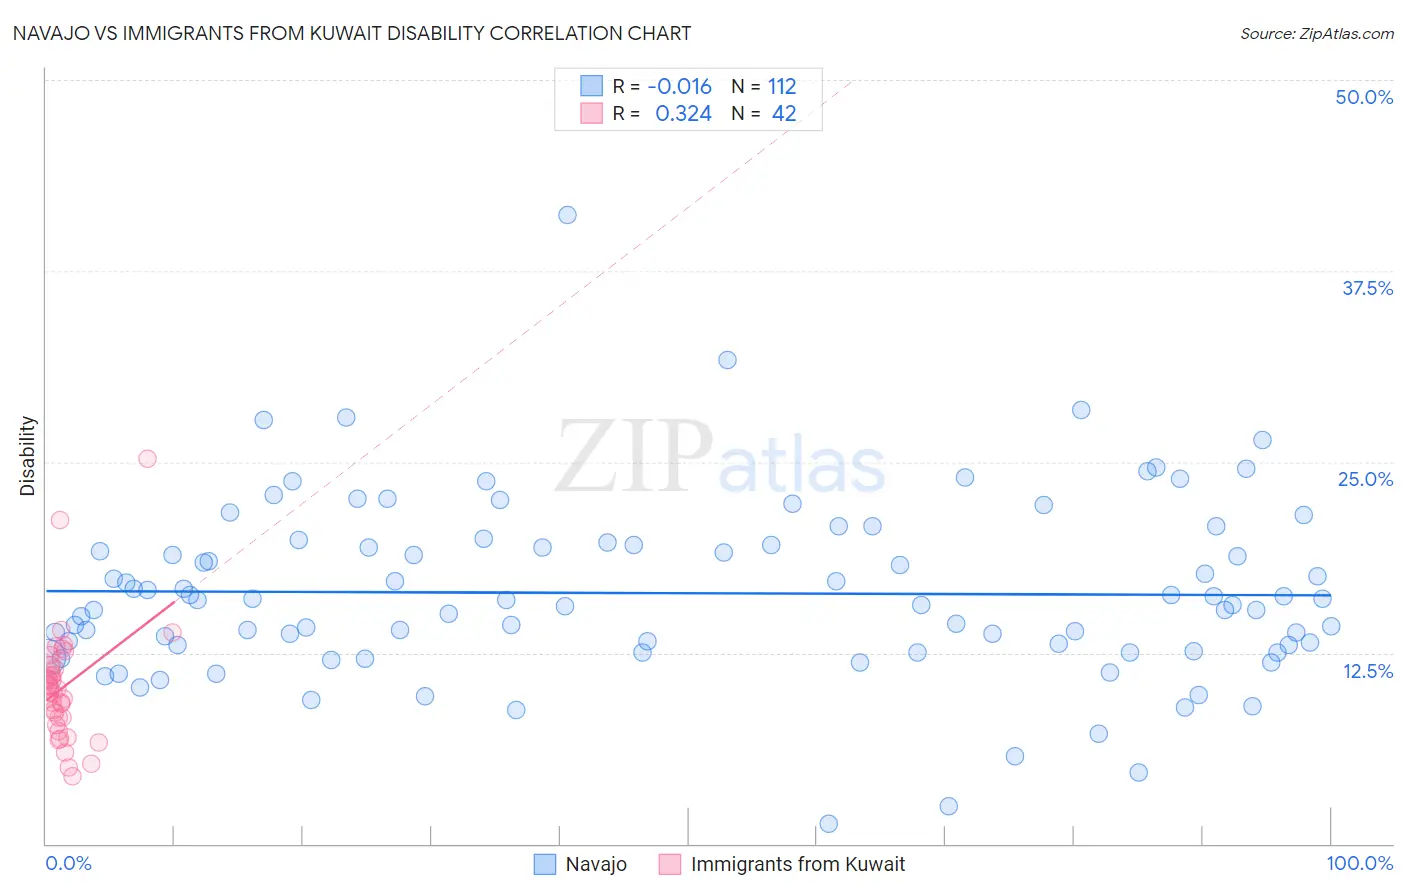
Navajo vs Immigrants from Kuwait Disability Correlation Chart
The statistical analysis conducted on geographies consisting of 224,790,018 people shows no correlation between the proportion of Navajo and percentage of population with a disability in the United States with a correlation coefficient (R) of -0.016 and weighted average of 14.3%. Similarly, the statistical analysis conducted on geographies consisting of 136,916,630 people shows a mild positive correlation between the proportion of Immigrants from Kuwait and percentage of population with a disability in the United States with a correlation coefficient (R) of 0.324 and weighted average of 10.7%, a difference of 33.6%.
Disability Correlation Summary
| Measurement | Navajo | Immigrants from Kuwait |
| Minimum | 1.3% | 4.4% |
| Maximum | 41.2% | 25.2% |
| Range | 39.9% | 20.8% |
| Mean | 16.4% | 10.3% |
| Median | 15.8% | 10.0% |
| Interquartile 25% (IQ1) | 12.8% | 8.3% |
| Interquartile 75% (IQ3) | 19.5% | 11.5% |
| Interquartile Range (IQR) | 6.7% | 3.2% |
| Standard Deviation (Sample) | 5.9% | 3.8% |
| Standard Deviation (Population) | 5.8% | 3.8% |
Similar Demographics by Disability
Demographics Similar to Navajo by Disability
In terms of disability, the demographic groups most similar to Navajo are Potawatomi (14.2%, a difference of 0.59%), Ottawa (14.2%, a difference of 0.71%), Immigrants from the Azores (14.2%, a difference of 0.71%), Osage (14.2%, a difference of 0.73%), and Native/Alaskan (14.2%, a difference of 0.76%).
| Demographics | Rating | Rank | Disability |
| Comanche | 0.0 /100 | #323 | Tragic 14.1% |
| Chippewa | 0.0 /100 | #324 | Tragic 14.1% |
| Natives/Alaskans | 0.0 /100 | #325 | Tragic 14.2% |
| Osage | 0.0 /100 | #326 | Tragic 14.2% |
| Ottawa | 0.0 /100 | #327 | Tragic 14.2% |
| Immigrants | Azores | 0.0 /100 | #328 | Tragic 14.2% |
| Potawatomi | 0.0 /100 | #329 | Tragic 14.2% |
| Navajo | 0.0 /100 | #330 | Tragic 14.3% |
| Alaskan Athabascans | 0.0 /100 | #331 | Tragic 14.4% |
| Pueblo | 0.0 /100 | #332 | Tragic 14.4% |
| Cajuns | 0.0 /100 | #333 | Tragic 14.6% |
| Yuman | 0.0 /100 | #334 | Tragic 14.6% |
| Tohono O'odham | 0.0 /100 | #335 | Tragic 14.8% |
| Cherokee | 0.0 /100 | #336 | Tragic 14.8% |
| Seminole | 0.0 /100 | #337 | Tragic 14.9% |
Demographics Similar to Immigrants from Kuwait by Disability
In terms of disability, the demographic groups most similar to Immigrants from Kuwait are Immigrants from Ethiopia (10.7%, a difference of 0.22%), Immigrants from Indonesia (10.7%, a difference of 0.23%), Paraguayan (10.6%, a difference of 0.25%), Ethiopian (10.7%, a difference of 0.29%), and Turkish (10.7%, a difference of 0.30%).
| Demographics | Rating | Rank | Disability |
| Argentineans | 100.0 /100 | #26 | Exceptional 10.6% |
| Cypriots | 100.0 /100 | #27 | Exceptional 10.6% |
| Egyptians | 100.0 /100 | #28 | Exceptional 10.6% |
| Immigrants | Argentina | 100.0 /100 | #29 | Exceptional 10.6% |
| Immigrants | Turkey | 100.0 /100 | #30 | Exceptional 10.6% |
| Immigrants | Egypt | 100.0 /100 | #31 | Exceptional 10.6% |
| Paraguayans | 100.0 /100 | #32 | Exceptional 10.6% |
| Immigrants | Kuwait | 100.0 /100 | #33 | Exceptional 10.7% |
| Immigrants | Ethiopia | 100.0 /100 | #34 | Exceptional 10.7% |
| Immigrants | Indonesia | 100.0 /100 | #35 | Exceptional 10.7% |
| Ethiopians | 100.0 /100 | #36 | Exceptional 10.7% |
| Turks | 100.0 /100 | #37 | Exceptional 10.7% |
| Afghans | 99.9 /100 | #38 | Exceptional 10.8% |
| Cambodians | 99.9 /100 | #39 | Exceptional 10.8% |
| Mongolians | 99.9 /100 | #40 | Exceptional 10.8% |