Japanese vs Immigrants from Fiji Disability Age Under 5
COMPARE
Japanese
Immigrants from Fiji
Disability Age Under 5
Disability Age Under 5 Comparison
Japanese
Immigrants from Fiji
1.2%
DISABILITY AGE UNDER 5
90.3/ 100
METRIC RATING
125th/ 347
METRIC RANK
0.92%
DISABILITY AGE UNDER 5
100.0/ 100
METRIC RATING
9th/ 347
METRIC RANK
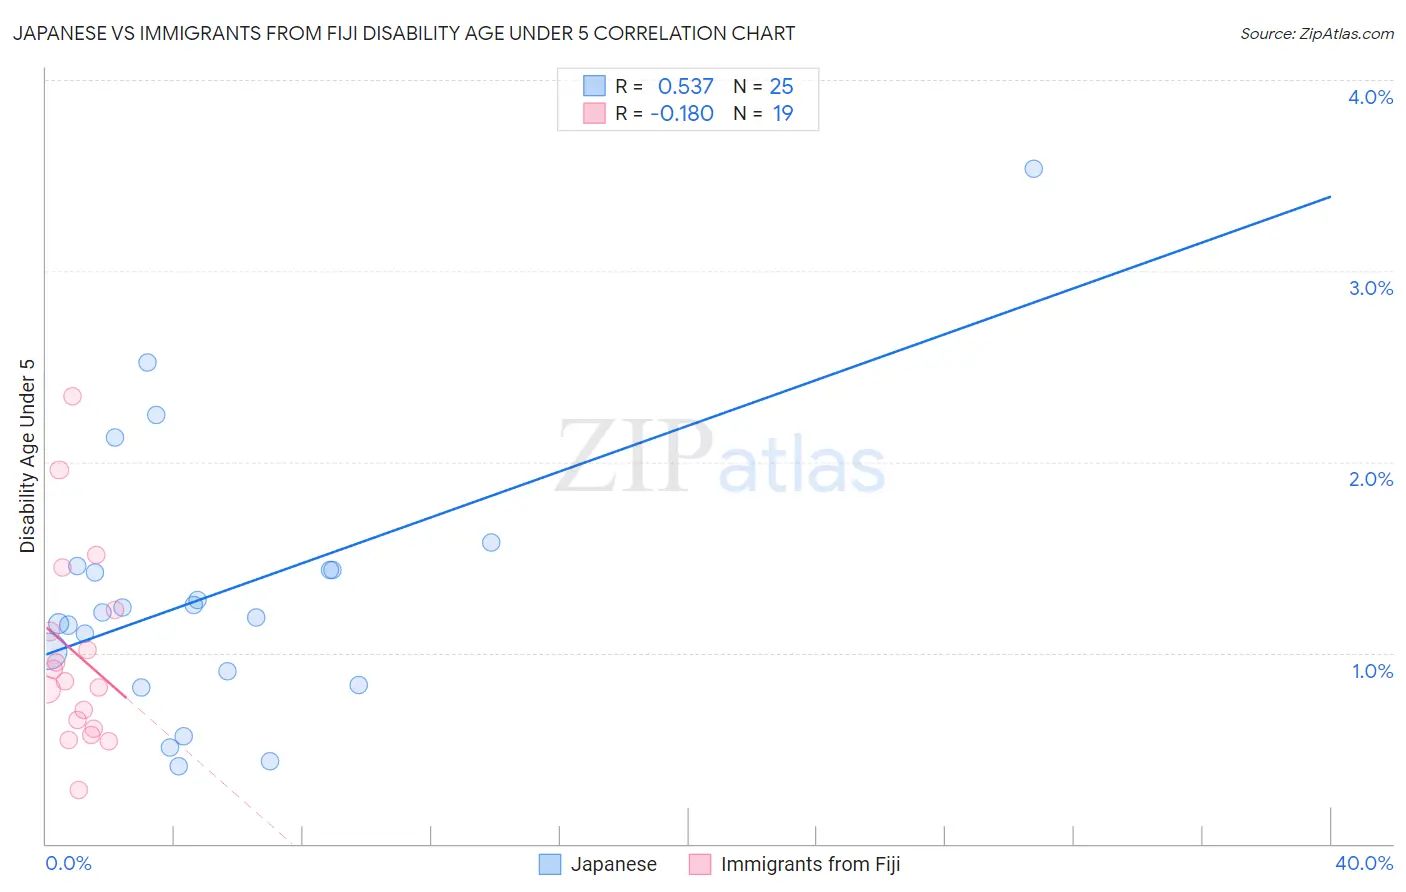
Japanese vs Immigrants from Fiji Disability Age Under 5 Correlation Chart
The statistical analysis conducted on geographies consisting of 161,189,921 people shows a substantial positive correlation between the proportion of Japanese and percentage of population with a disability under the age of 5 in the United States with a correlation coefficient (R) of 0.537 and weighted average of 1.2%. Similarly, the statistical analysis conducted on geographies consisting of 74,961,112 people shows a poor negative correlation between the proportion of Immigrants from Fiji and percentage of population with a disability under the age of 5 in the United States with a correlation coefficient (R) of -0.180 and weighted average of 0.92%, a difference of 28.4%.
Disability Age Under 5 Correlation Summary
| Measurement | Japanese | Immigrants from Fiji |
| Minimum | 0.40% | 0.28% |
| Maximum | 3.5% | 2.3% |
| Range | 3.1% | 2.1% |
| Mean | 1.3% | 0.99% |
| Median | 1.2% | 0.85% |
| Interquartile 25% (IQ1) | 0.87% | 0.60% |
| Interquartile 75% (IQ3) | 1.4% | 1.2% |
| Interquartile Range (IQR) | 0.58% | 0.62% |
| Standard Deviation (Sample) | 0.70% | 0.52% |
| Standard Deviation (Population) | 0.69% | 0.50% |
Similar Demographics by Disability Age Under 5
Demographics Similar to Japanese by Disability Age Under 5
In terms of disability age under 5, the demographic groups most similar to Japanese are Immigrants from Cambodia (1.2%, a difference of 0.060%), Zimbabwean (1.2%, a difference of 0.080%), Aleut (1.2%, a difference of 0.13%), Central American (1.2%, a difference of 0.16%), and Immigrants from Senegal (1.2%, a difference of 0.32%).
| Demographics | Rating | Rank | Disability Age Under 5 |
| Immigrants | Venezuela | 93.4 /100 | #118 | Exceptional 1.2% |
| Bhutanese | 92.5 /100 | #119 | Exceptional 1.2% |
| Immigrants | Eritrea | 92.3 /100 | #120 | Exceptional 1.2% |
| Immigrants | Senegal | 91.4 /100 | #121 | Exceptional 1.2% |
| Aleuts | 90.7 /100 | #122 | Exceptional 1.2% |
| Zimbabweans | 90.6 /100 | #123 | Exceptional 1.2% |
| Immigrants | Cambodia | 90.5 /100 | #124 | Exceptional 1.2% |
| Japanese | 90.3 /100 | #125 | Exceptional 1.2% |
| Central Americans | 89.7 /100 | #126 | Excellent 1.2% |
| Immigrants | Romania | 88.4 /100 | #127 | Excellent 1.2% |
| Immigrants | France | 88.4 /100 | #128 | Excellent 1.2% |
| Immigrants | Immigrants | 88.0 /100 | #129 | Excellent 1.2% |
| Koreans | 87.7 /100 | #130 | Excellent 1.2% |
| Immigrants | Serbia | 87.6 /100 | #131 | Excellent 1.2% |
| Immigrants | Eastern Europe | 87.3 /100 | #132 | Excellent 1.2% |
Demographics Similar to Immigrants from Fiji by Disability Age Under 5
In terms of disability age under 5, the demographic groups most similar to Immigrants from Fiji are Immigrants from Yemen (0.91%, a difference of 1.1%), Immigrants from Afghanistan (0.91%, a difference of 1.2%), Marshallese (0.94%, a difference of 2.1%), Afghan (0.94%, a difference of 2.9%), and Immigrants from Grenada (0.94%, a difference of 2.9%).
| Demographics | Rating | Rank | Disability Age Under 5 |
| Immigrants | St. Vincent and the Grenadines | 100.0 /100 | #2 | Exceptional 0.79% |
| Vietnamese | 100.0 /100 | #3 | Exceptional 0.81% |
| Immigrants | Uzbekistan | 100.0 /100 | #4 | Exceptional 0.85% |
| Immigrants | Bangladesh | 100.0 /100 | #5 | Exceptional 0.85% |
| Ute | 100.0 /100 | #6 | Exceptional 0.86% |
| Immigrants | Afghanistan | 100.0 /100 | #7 | Exceptional 0.91% |
| Immigrants | Yemen | 100.0 /100 | #8 | Exceptional 0.91% |
| Immigrants | Fiji | 100.0 /100 | #9 | Exceptional 0.92% |
| Marshallese | 100.0 /100 | #10 | Exceptional 0.94% |
| Afghans | 100.0 /100 | #11 | Exceptional 0.94% |
| Immigrants | Grenada | 100.0 /100 | #12 | Exceptional 0.94% |
| Soviet Union | 100.0 /100 | #13 | Exceptional 0.95% |
| Yuman | 100.0 /100 | #14 | Exceptional 0.95% |
| Immigrants | Hong Kong | 100.0 /100 | #15 | Exceptional 0.95% |
| Immigrants | Israel | 100.0 /100 | #16 | Exceptional 0.96% |