Immigrants from South Africa vs Alsatian Disability
COMPARE
Immigrants from South Africa
Alsatian
Disability
Disability Comparison
Immigrants from South Africa
Alsatians
11.2%
DISABILITY
98.2/ 100
METRIC RATING
89th/ 347
METRIC RANK
12.1%
DISABILITY
3.3/ 100
METRIC RATING
227th/ 347
METRIC RANK
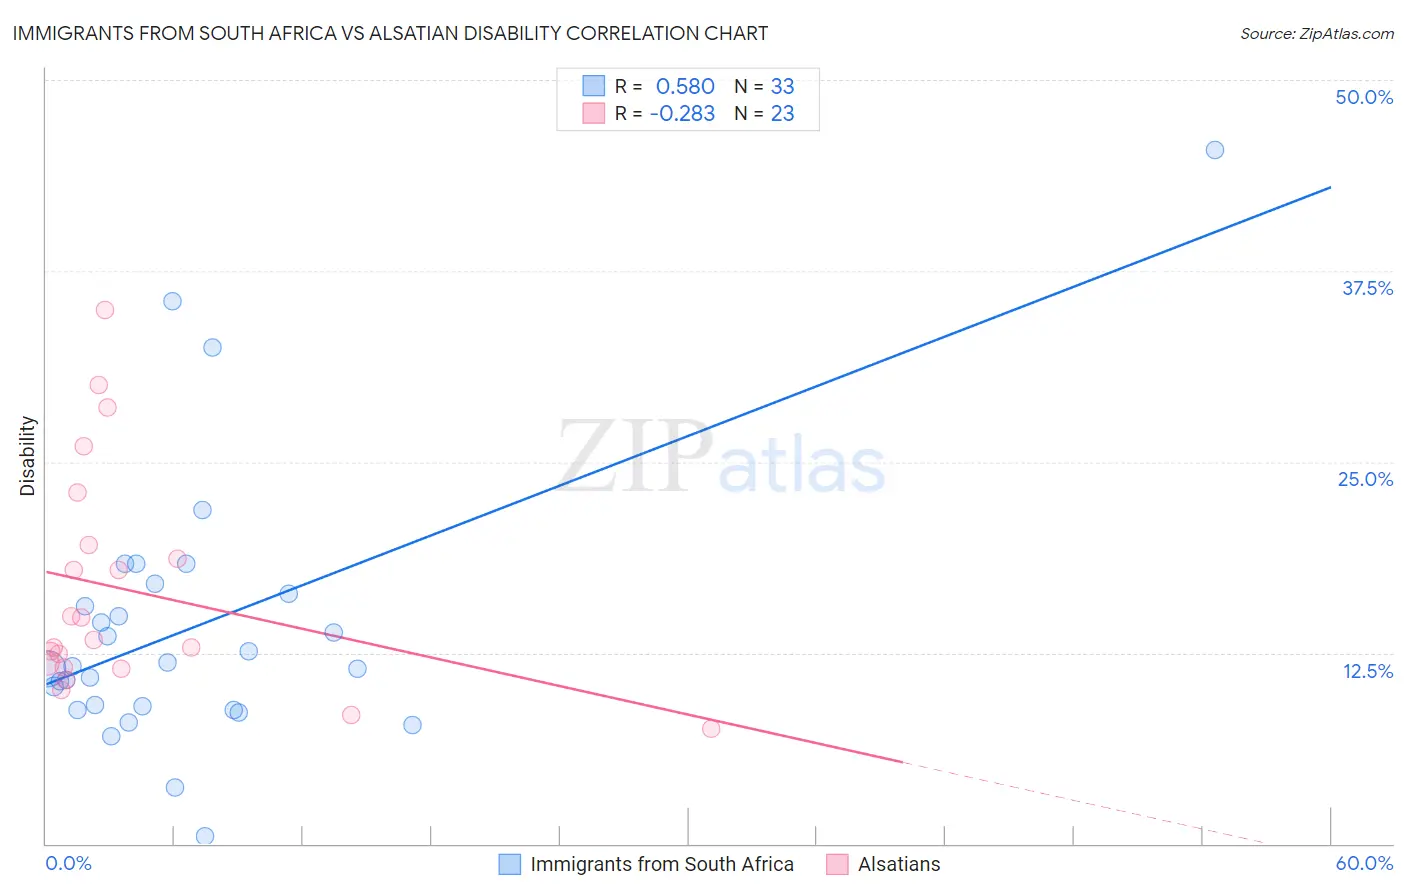
Immigrants from South Africa vs Alsatian Disability Correlation Chart
The statistical analysis conducted on geographies consisting of 233,313,219 people shows a substantial positive correlation between the proportion of Immigrants from South Africa and percentage of population with a disability in the United States with a correlation coefficient (R) of 0.580 and weighted average of 11.2%. Similarly, the statistical analysis conducted on geographies consisting of 82,681,540 people shows a weak negative correlation between the proportion of Alsatians and percentage of population with a disability in the United States with a correlation coefficient (R) of -0.283 and weighted average of 12.1%, a difference of 8.6%.
Disability Correlation Summary
| Measurement | Immigrants from South Africa | Alsatian |
| Minimum | 0.46% | 7.5% |
| Maximum | 45.5% | 34.9% |
| Range | 45.0% | 27.4% |
| Mean | 14.2% | 16.6% |
| Median | 11.7% | 13.4% |
| Interquartile 25% (IQ1) | 8.9% | 11.5% |
| Interquartile 75% (IQ3) | 16.7% | 19.6% |
| Interquartile Range (IQR) | 7.8% | 8.0% |
| Standard Deviation (Sample) | 8.9% | 7.3% |
| Standard Deviation (Population) | 8.8% | 7.2% |
Similar Demographics by Disability
Demographics Similar to Immigrants from South Africa by Disability
In terms of disability, the demographic groups most similar to Immigrants from South Africa are Immigrants from Brazil (11.2%, a difference of 0.050%), Immigrants from Western Asia (11.2%, a difference of 0.070%), Ecuadorian (11.2%, a difference of 0.11%), Immigrants from Ecuador (11.2%, a difference of 0.11%), and Immigrants from Morocco (11.2%, a difference of 0.23%).
| Demographics | Rating | Rank | Disability |
| Chileans | 99.1 /100 | #82 | Exceptional 11.1% |
| Immigrants | Switzerland | 99.0 /100 | #83 | Exceptional 11.1% |
| Immigrants | Sierra Leone | 99.0 /100 | #84 | Exceptional 11.1% |
| Immigrants | Belarus | 98.9 /100 | #85 | Exceptional 11.1% |
| Immigrants | Russia | 98.9 /100 | #86 | Exceptional 11.1% |
| Palestinians | 98.9 /100 | #87 | Exceptional 11.1% |
| Immigrants | Romania | 98.5 /100 | #88 | Exceptional 11.2% |
| Immigrants | South Africa | 98.2 /100 | #89 | Exceptional 11.2% |
| Immigrants | Brazil | 98.1 /100 | #90 | Exceptional 11.2% |
| Immigrants | Western Asia | 98.1 /100 | #91 | Exceptional 11.2% |
| Ecuadorians | 98.0 /100 | #92 | Exceptional 11.2% |
| Immigrants | Ecuador | 98.0 /100 | #93 | Exceptional 11.2% |
| Immigrants | Morocco | 97.8 /100 | #94 | Exceptional 11.2% |
| Eastern Europeans | 97.8 /100 | #95 | Exceptional 11.2% |
| Immigrants | Zimbabwe | 97.7 /100 | #96 | Exceptional 11.2% |
Demographics Similar to Alsatians by Disability
In terms of disability, the demographic groups most similar to Alsatians are Jamaican (12.1%, a difference of 0.010%), Senegalese (12.1%, a difference of 0.060%), Mexican (12.1%, a difference of 0.14%), West Indian (12.2%, a difference of 0.14%), and Inupiat (12.2%, a difference of 0.16%).
| Demographics | Rating | Rank | Disability |
| Immigrants | Bahamas | 4.7 /100 | #220 | Tragic 12.1% |
| Northern Europeans | 4.2 /100 | #221 | Tragic 12.1% |
| Spanish American Indians | 4.1 /100 | #222 | Tragic 12.1% |
| Hispanics or Latinos | 3.9 /100 | #223 | Tragic 12.1% |
| Mexicans | 3.7 /100 | #224 | Tragic 12.1% |
| Senegalese | 3.5 /100 | #225 | Tragic 12.1% |
| Jamaicans | 3.3 /100 | #226 | Tragic 12.1% |
| Alsatians | 3.3 /100 | #227 | Tragic 12.1% |
| West Indians | 2.9 /100 | #228 | Tragic 12.2% |
| Inupiat | 2.8 /100 | #229 | Tragic 12.2% |
| Samoans | 2.6 /100 | #230 | Tragic 12.2% |
| Malaysians | 2.5 /100 | #231 | Tragic 12.2% |
| Italians | 2.5 /100 | #232 | Tragic 12.2% |
| Bahamians | 2.3 /100 | #233 | Tragic 12.2% |
| Japanese | 2.3 /100 | #234 | Tragic 12.2% |