Immigrants from Latvia vs Immigrants from Iran Disability
COMPARE
Immigrants from Latvia
Immigrants from Iran
Disability
Disability Comparison
Immigrants from Latvia
Immigrants from Iran
11.4%
DISABILITY
90.9/ 100
METRIC RATING
126th/ 347
METRIC RANK
10.3%
DISABILITY
100.0/ 100
METRIC RATING
17th/ 347
METRIC RANK
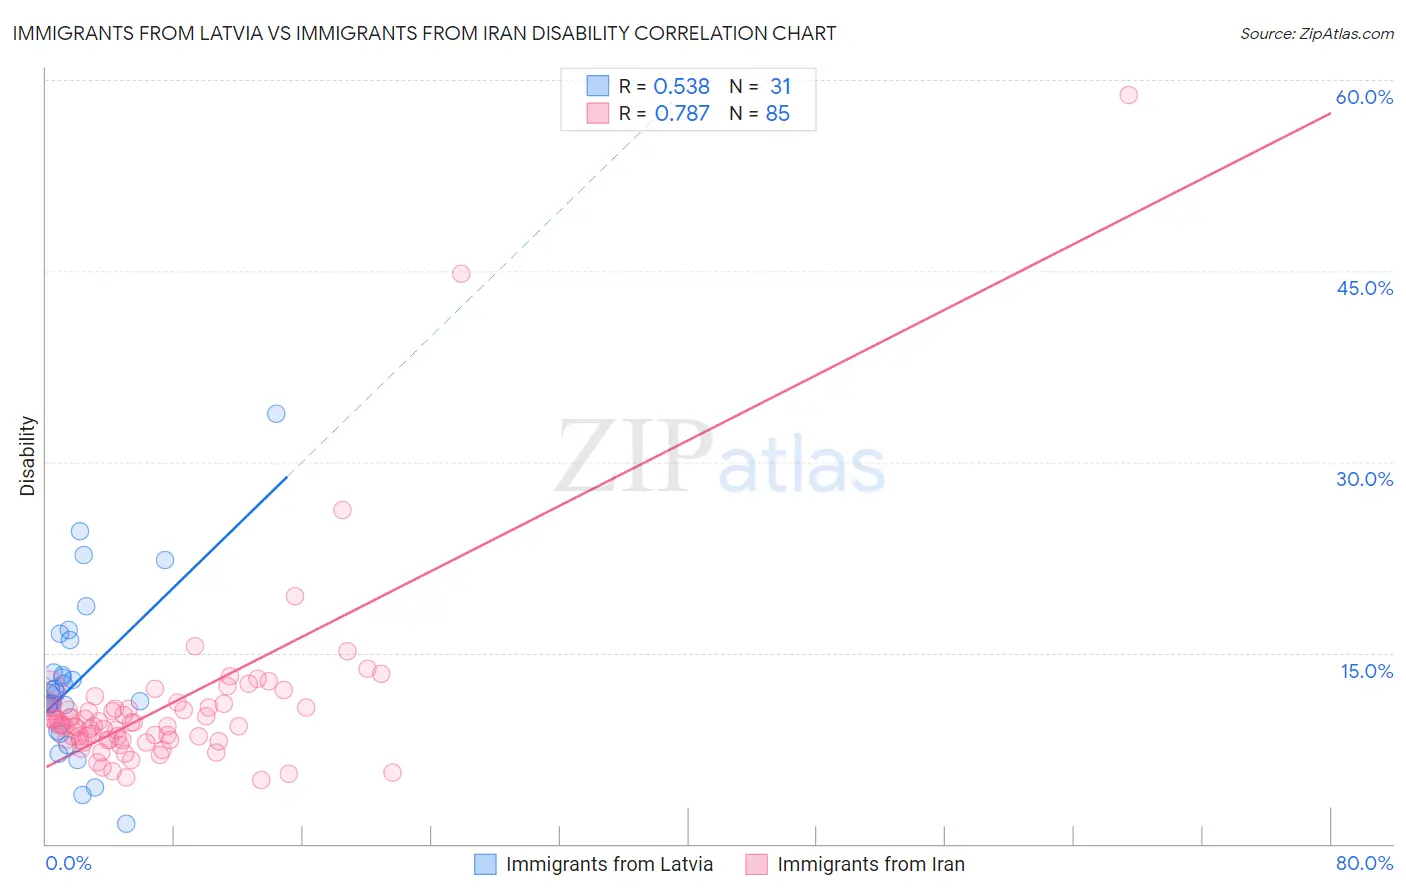
Immigrants from Latvia vs Immigrants from Iran Disability Correlation Chart
The statistical analysis conducted on geographies consisting of 113,739,259 people shows a substantial positive correlation between the proportion of Immigrants from Latvia and percentage of population with a disability in the United States with a correlation coefficient (R) of 0.538 and weighted average of 11.4%. Similarly, the statistical analysis conducted on geographies consisting of 279,897,593 people shows a strong positive correlation between the proportion of Immigrants from Iran and percentage of population with a disability in the United States with a correlation coefficient (R) of 0.787 and weighted average of 10.3%, a difference of 11.1%.
Disability Correlation Summary
| Measurement | Immigrants from Latvia | Immigrants from Iran |
| Minimum | 1.5% | 5.0% |
| Maximum | 33.8% | 58.9% |
| Range | 32.2% | 53.8% |
| Mean | 12.9% | 10.7% |
| Median | 11.9% | 9.3% |
| Interquartile 25% (IQ1) | 8.8% | 8.1% |
| Interquartile 75% (IQ3) | 16.0% | 10.7% |
| Interquartile Range (IQR) | 7.2% | 2.6% |
| Standard Deviation (Sample) | 6.5% | 7.2% |
| Standard Deviation (Population) | 6.4% | 7.1% |
Similar Demographics by Disability
Demographics Similar to Immigrants from Latvia by Disability
In terms of disability, the demographic groups most similar to Immigrants from Latvia are Immigrants from Italy (11.4%, a difference of 0.070%), Immigrants from Europe (11.4%, a difference of 0.070%), Macedonian (11.4%, a difference of 0.080%), Latvian (11.4%, a difference of 0.14%), and Costa Rican (11.4%, a difference of 0.15%).
| Demographics | Rating | Rank | Disability |
| Central Americans | 93.5 /100 | #119 | Exceptional 11.4% |
| Immigrants | North Macedonia | 93.5 /100 | #120 | Exceptional 11.4% |
| Immigrants | Costa Rica | 93.4 /100 | #121 | Exceptional 11.4% |
| Brazilians | 93.3 /100 | #122 | Exceptional 11.4% |
| South Africans | 92.3 /100 | #123 | Exceptional 11.4% |
| South American Indians | 92.2 /100 | #124 | Exceptional 11.4% |
| Costa Ricans | 91.9 /100 | #125 | Exceptional 11.4% |
| Immigrants | Latvia | 90.9 /100 | #126 | Exceptional 11.4% |
| Immigrants | Italy | 90.4 /100 | #127 | Exceptional 11.4% |
| Immigrants | Europe | 90.4 /100 | #128 | Exceptional 11.4% |
| Macedonians | 90.3 /100 | #129 | Exceptional 11.4% |
| Latvians | 89.8 /100 | #130 | Excellent 11.4% |
| Immigrants | Croatia | 89.8 /100 | #131 | Excellent 11.4% |
| Immigrants | Africa | 89.3 /100 | #132 | Excellent 11.4% |
| Arabs | 89.1 /100 | #133 | Excellent 11.4% |
Demographics Similar to Immigrants from Iran by Disability
In terms of disability, the demographic groups most similar to Immigrants from Iran are Indian (Asian) (10.3%, a difference of 0.070%), Okinawan (10.3%, a difference of 0.13%), Immigrants from Korea (10.2%, a difference of 0.44%), Burmese (10.4%, a difference of 0.99%), and Immigrants from Pakistan (10.4%, a difference of 0.99%).
| Demographics | Rating | Rank | Disability |
| Immigrants | China | 100.0 /100 | #10 | Exceptional 10.1% |
| Iranians | 100.0 /100 | #11 | Exceptional 10.1% |
| Immigrants | Israel | 100.0 /100 | #12 | Exceptional 10.1% |
| Immigrants | Eastern Asia | 100.0 /100 | #13 | Exceptional 10.2% |
| Immigrants | Korea | 100.0 /100 | #14 | Exceptional 10.2% |
| Okinawans | 100.0 /100 | #15 | Exceptional 10.3% |
| Indians (Asian) | 100.0 /100 | #16 | Exceptional 10.3% |
| Immigrants | Iran | 100.0 /100 | #17 | Exceptional 10.3% |
| Burmese | 100.0 /100 | #18 | Exceptional 10.4% |
| Immigrants | Pakistan | 100.0 /100 | #19 | Exceptional 10.4% |
| Immigrants | Venezuela | 100.0 /100 | #20 | Exceptional 10.4% |
| Asians | 100.0 /100 | #21 | Exceptional 10.4% |
| Immigrants | Sri Lanka | 100.0 /100 | #22 | Exceptional 10.5% |
| Immigrants | Asia | 100.0 /100 | #23 | Exceptional 10.5% |
| Venezuelans | 100.0 /100 | #24 | Exceptional 10.5% |