European vs Pima Disability Age Under 5

COMPARE

European
Race
Ancestry
AfghanAfricanAlaska NativeAlaskan AthabascanAlbanianAleutAlsatianAmericanApacheArabArapahoArgentineanArmenianAssyrian/Chaldean/SyriacAustralianAustrianBahamianBangladeshiBarbadianBasqueBelgianBelizeanBermudanBhutaneseBlackfeetBolivianBrazilianBritishBritish West IndianBulgarianBurmeseCajunCambodianCanadianCape VerdeanCarpatho RusynCelticCentral AmericanCentral American IndianCherokeeCheyenneChickasawChileanChineseChippewaChoctawColombianColvilleComancheCosta RicanCreeCreekCroatianCrowCubanCypriotCzechCzechoslovakianDanishDelawareDominicanDutchDutch West IndianEastern EuropeanEcuadorianEgyptianEnglishEstonianEthiopianEuropeanFijianFilipinoFinnishFrenchFrench American IndianFrench CanadianGermanGerman RussianGhanaianGreekGuamanian/ChamorroGuatemalanGuyaneseHaitianHmongHonduranHopiHoumaHungarianIcelanderIndian (Asian)IndonesianInupiatIranianIraqiIrishIroquoisIsraeliItalianJamaicanJapaneseJordanianKenyanKiowaKoreanLaotianLatvianLebaneseLiberianLithuanianLumbeeLuxembourgerMacedonianMalaysianMalteseMarshalleseMenomineeMexicanMexican American IndianMongolianMoroccanNative HawaiianNavajoNepaleseNew ZealanderNicaraguanNigerianNorthern EuropeanNorwegianOkinawanOsageOttawaPaiutePakistaniPalestinianPanamanianParaguayanPennsylvania GermanPeruvianPolishPortuguesePotawatomiPuebloPuerto RicanPuget Sound SalishRomanianRussianSalvadoranSamoanScandinavianScotch-IrishScottishSeminoleSenegaleseSerbianShoshoneSierra LeoneanSiouxSlavicSlovakSloveneSomaliSouth AfricanSouth AmericanSouth American IndianSoviet UnionSpaniardSpanishSpanish AmericanSpanish American IndianSri LankanSubsaharan AfricanSudaneseSwedishSwissSyrianTaiwaneseThaiTlingit-HaidaTohono O'OdhamTonganTrinidadian and TobagonianTsimshianTurkishU.S. Virgin IslanderUgandanUkrainianUruguayanUteVenezuelanVietnameseWelshWest IndianYakamaYaquiYugoslavianYumanYup'ikZimbabwean
Immigration
NonimmigrantsImmigrantsAfghanistanAfricaAlbaniaArgentinaArmeniaAsiaAustraliaAustriaBahamasBangladeshBarbadosBelarusBelgiumBelizeBoliviaBosnia and HerzegovinaBrazilBulgariaBurma/MyanmarCabo VerdeCambodiaCameroonCanadaCaribbeanCentral AmericaChileChinaColombiaCongoCosta RicaCroatiaCubaCzechoslovakiaDenmarkDominicaDominican RepublicEastern AfricaEastern AsiaEastern EuropeEcuadorEgyptEl SalvadorEnglandEritreaEthiopiaEuropeFijiFranceGermanyGhanaGreeceGrenadaGuatemalaGuyanaHaitiHondurasHong KongHungaryIndiaIndonesiaIranIraqIrelandIsraelItalyJamaicaJapanJordanKazakhstanKenyaKoreaKuwaitLaosLatin AmericaLatviaLebanonLiberiaLithuaniaMalaysiaMexicoMicronesiaMiddle AfricaMoldovaMoroccoNepalNetherlandsNicaraguaNigeriaNorth AmericaNorth MacedoniaNorthern AfricaNorthern EuropeNorwayOceaniaPakistanPanamaPeruPhilippinesPolandPortugalRomaniaRussiaSaudi ArabiaScotlandSenegalSerbiaSierra LeoneSingaporeSomaliaSouth AfricaSouth AmericaSouth Central AsiaSouth Eastern AsiaSouthern EuropeSpainSri LankaSt. Vincent and the GrenadinesSudanSwedenSwitzerlandSyriaTaiwanThailandTrinidad and TobagoTurkeyUgandaUkraineUruguayUzbekistanVenezuelaVietnamWest IndiesWestern AfricaWestern AsiaWestern EuropeYemenZaireZimbabweAzores
Pima
Race
Ancestry
AfghanAfricanAlaska NativeAlaskan AthabascanAlbanianAleutAlsatianAmericanApacheArabArapahoArgentineanArmenianAssyrian/Chaldean/SyriacAustralianAustrianBahamianBangladeshiBarbadianBasqueBelgianBelizeanBermudanBhutaneseBlackfeetBolivianBrazilianBritishBritish West IndianBulgarianBurmeseCajunCambodianCanadianCape VerdeanCarpatho RusynCelticCentral AmericanCentral American IndianCherokeeCheyenneChickasawChileanChineseChippewaChoctawColombianColvilleComancheCosta RicanCreeCreekCroatianCrowCubanCypriotCzechCzechoslovakianDanishDelawareDominicanDutchDutch West IndianEastern EuropeanEcuadorianEgyptianEnglishEstonianEthiopianFijianFilipinoFinnishFrenchFrench American IndianFrench CanadianGermanGerman RussianGhanaianGreekGuamanian/ChamorroGuatemalanGuyaneseHaitianHmongHonduranHopiHoumaHungarianIcelanderIndian (Asian)IndonesianInupiatIranianIraqiIrishIroquoisIsraeliItalianJamaicanJapaneseJordanianKenyanKiowaKoreanLaotianLatvianLebaneseLiberianLithuanianLumbeeLuxembourgerMacedonianMalaysianMalteseMarshalleseMenomineeMexicanMexican American IndianMongolianMoroccanNative HawaiianNavajoNepaleseNew ZealanderNicaraguanNigerianNorthern EuropeanNorwegianOkinawanOsageOttawaPaiutePakistaniPalestinianPanamanianParaguayanPennsylvania GermanPeruvianPimaPolishPortuguesePotawatomiPuebloPuerto RicanPuget Sound SalishRomanianRussianSalvadoranSamoanScandinavianScotch-IrishScottishSeminoleSenegaleseSerbianShoshoneSierra LeoneanSiouxSlavicSlovakSloveneSomaliSouth AfricanSouth AmericanSouth American IndianSoviet UnionSpaniardSpanishSpanish AmericanSpanish American IndianSri LankanSubsaharan AfricanSudaneseSwedishSwissSyrianTaiwaneseThaiTlingit-HaidaTohono O'OdhamTonganTrinidadian and TobagonianTsimshianTurkishU.S. Virgin IslanderUgandanUkrainianUruguayanUteVenezuelanVietnameseWelshWest IndianYakamaYaquiYugoslavianYumanYup'ikZimbabwean
Immigration
NonimmigrantsImmigrantsAfghanistanAfricaAlbaniaArgentinaArmeniaAsiaAustraliaAustriaBahamasBangladeshBarbadosBelarusBelgiumBelizeBoliviaBosnia and HerzegovinaBrazilBulgariaBurma/MyanmarCabo VerdeCambodiaCameroonCanadaCaribbeanCentral AmericaChileChinaColombiaCongoCosta RicaCroatiaCubaCzechoslovakiaDenmarkDominicaDominican RepublicEastern AfricaEastern AsiaEastern EuropeEcuadorEgyptEl SalvadorEnglandEritreaEthiopiaEuropeFijiFranceGermanyGhanaGreeceGrenadaGuatemalaGuyanaHaitiHondurasHong KongHungaryIndiaIndonesiaIranIraqIrelandIsraelItalyJamaicaJapanJordanKazakhstanKenyaKoreaKuwaitLaosLatin AmericaLatviaLebanonLiberiaLithuaniaMalaysiaMexicoMicronesiaMiddle AfricaMoldovaMoroccoNepalNetherlandsNicaraguaNigeriaNorth AmericaNorth MacedoniaNorthern AfricaNorthern EuropeNorwayOceaniaPakistanPanamaPeruPhilippinesPolandPortugalRomaniaRussiaSaudi ArabiaScotlandSenegalSerbiaSierra LeoneSingaporeSomaliaSouth AfricaSouth AmericaSouth Central AsiaSouth Eastern AsiaSouthern EuropeSpainSri LankaSt. Vincent and the GrenadinesSudanSwedenSwitzerlandSyriaTaiwanThailandTrinidad and TobagoTurkeyUgandaUkraineUruguayUzbekistanVenezuelaVietnamWest IndiesWestern AfricaWestern AsiaWestern EuropeYemenZaireZimbabweAzores
Disability Age Under 5
Income
Poverty
Unemployment
Labor Participation
Family Structure
Vehicle Availability
Education Level
Disability

Disability Age Under 5 Comparison

Europeans

Pima

Tragic
Exceptional
1.5%
DISABILITY AGE UNDER 5
0.0/ 100
METRIC RATING
284th/ 347
METRIC RANK
1.1%
DISABILITY AGE UNDER 5
99.8/ 100
METRIC RATING
43rd/ 347
METRIC RANK

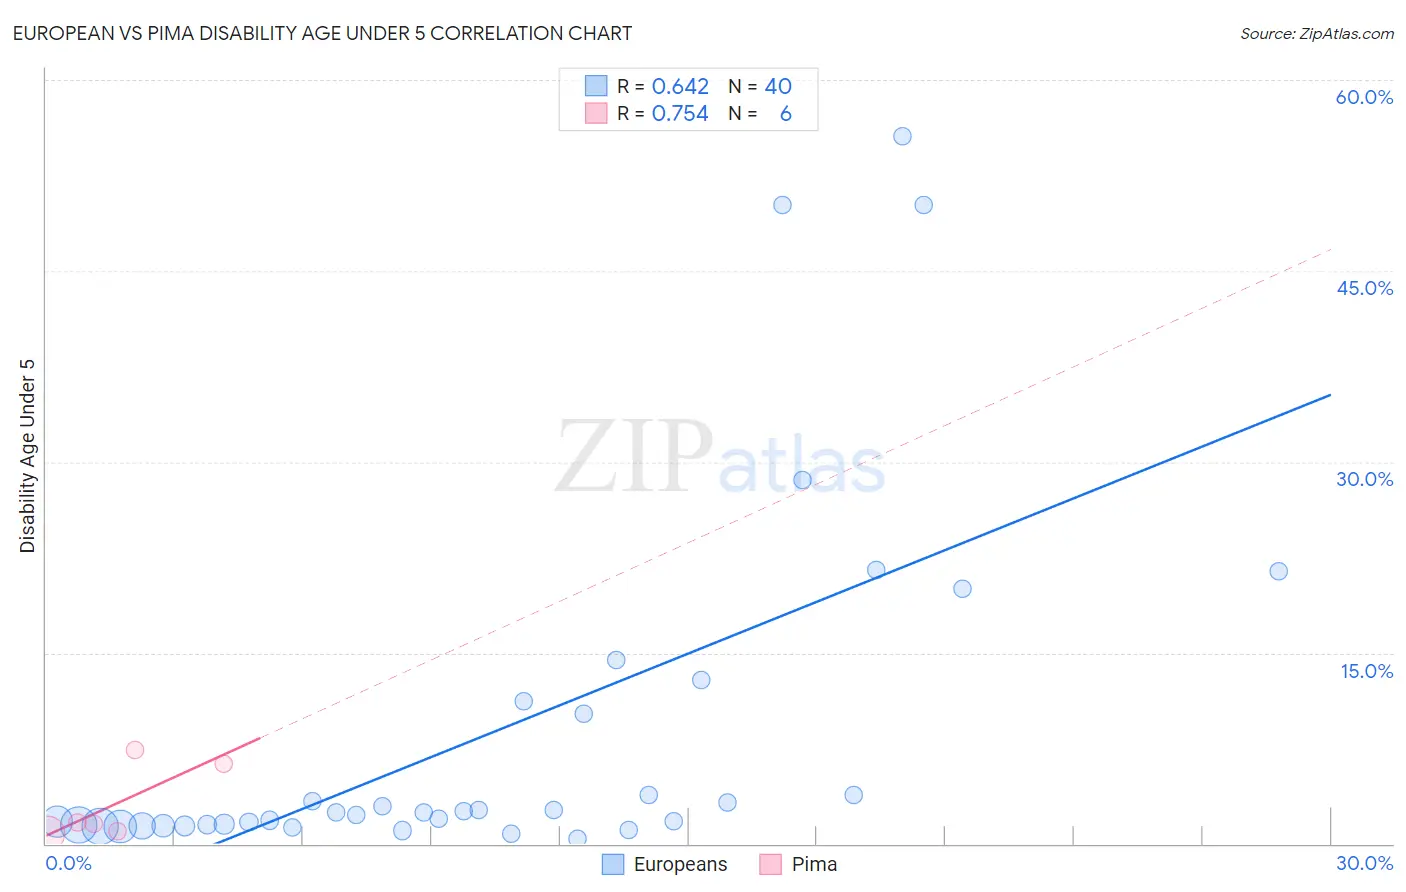
European vs Pima Disability Age Under 5 Correlation Chart

The statistical analysis conducted on geographies consisting of 258,994,834 people shows a significant positive correlation between the proportion of Europeans and percentage of population with a disability under the age of 5 in the United States with a correlation coefficient (R) of 0.642 and weighted average of 1.5%. Similarly, the statistical analysis conducted on geographies consisting of 52,697,039 people shows a strong positive correlation between the proportion of Pima and percentage of population with a disability under the age of 5 in the United States with a correlation coefficient (R) of 0.754 and weighted average of 1.1%, a difference of 43.3%.
European vs Pima Disability Age Under 5

Disability Age Under 5 Correlation Summary

MeasurementEuropeanPima
Minimum0.42%0.81%
Maximum55.6%7.3%
Range55.1%6.5%
Mean8.8%3.1%
Median2.4%1.6%
Interquartile 25% (IQ1)1.4%0.99%
Interquartile 75% (IQ3)10.7%6.3%
Interquartile Range (IQR)9.2%5.3%
Standard Deviation (Sample)14.2%2.9%
Standard Deviation (Population)14.0%2.7%

Similar Demographics by Disability Age Under 5

Demographics Similar to Europeans by Disability Age Under 5

In terms of disability age under 5, the demographic groups most similar to Europeans are Delaware (1.5%, a difference of 0.050%), Cheyenne (1.5%, a difference of 0.25%), Czechoslovakian (1.5%, a difference of 0.59%), Croatian (1.5%, a difference of 1.2%), and Tlingit-Haida (1.5%, a difference of 1.4%).
DemographicsRating | RankDisability Age Under 5
Canadians
0.0
/100
|
#277
Tragic
1.5%
Kiowa
0.0
/100
|
#278
Tragic
1.5%
Danes
0.0
/100
|
#279
Tragic
1.5%
British
0.0
/100
|
#280
Tragic
1.5%
Czechoslovakians
0.0
/100
|
#281
Tragic
1.5%
Cheyenne
0.0
/100
|
#282
Tragic
1.5%
Delaware
0.0
/100
|
#283
Tragic
1.5%
Europeans
0.0
/100
|
#284
Tragic
1.5%
Croatians
0.0
/100
|
#285
Tragic
1.5%
Tlingit-Haida
0.0
/100
|
#286
Tragic
1.5%
Scandinavians
0.0
/100
|
#287
Tragic
1.5%
Estonians
0.0
/100
|
#288
Tragic
1.5%
Hungarians
0.0
/100
|
#289
Tragic
1.5%
Czechs
0.0
/100
|
#290
Tragic
1.5%
Northern Europeans
0.0
/100
|
#291
Tragic
1.6%

Demographics Similar to Pima by Disability Age Under 5

In terms of disability age under 5, the demographic groups most similar to Pima are Immigrants from Bulgaria (1.1%, a difference of 0.010%), Immigrants from Asia (1.1%, a difference of 0.090%), Thai (1.1%, a difference of 0.11%), Immigrants from Turkey (1.1%, a difference of 0.32%), and Immigrants from Albania (1.1%, a difference of 0.52%).
DemographicsRating | RankDisability Age Under 5
Immigrants | Nepal
99.9
/100
|
#36
Exceptional
1.0%
Immigrants | India
99.9
/100
|
#37
Exceptional
1.0%
Immigrants | Guyana
99.9
/100
|
#38
Exceptional
1.0%
Filipinos
99.9
/100
|
#39
Exceptional
1.1%
Immigrants | Albania
99.9
/100
|
#40
Exceptional
1.1%
Thais
99.8
/100
|
#41
Exceptional
1.1%
Immigrants | Bulgaria
99.8
/100
|
#42
Exceptional
1.1%
Pima
99.8
/100
|
#43
Exceptional
1.1%
Immigrants | Asia
99.8
/100
|
#44
Exceptional
1.1%
Immigrants | Turkey
99.8
/100
|
#45
Exceptional
1.1%
Immigrants | Congo
99.8
/100
|
#46
Exceptional
1.1%
Immigrants | Sweden
99.8
/100
|
#47
Exceptional
1.1%
Immigrants | Singapore
99.7
/100
|
#48
Exceptional
1.1%
Immigrants | Russia
99.7
/100
|
#49
Exceptional
1.1%
Immigrants | Japan
99.7
/100
|
#50
Exceptional
1.1%