Cypriot vs European Community Comparison
COMPARE
Cypriot
European
Social Comparison
Social Comparison
Cypriots
Europeans
8,674
SOCIAL INDEX
84.2/ 100
SOCIAL RATING
58th/ 347
SOCIAL RANK
8,117
SOCIAL INDEX
78.6/ 100
SOCIAL RATING
87th/ 347
SOCIAL RANK
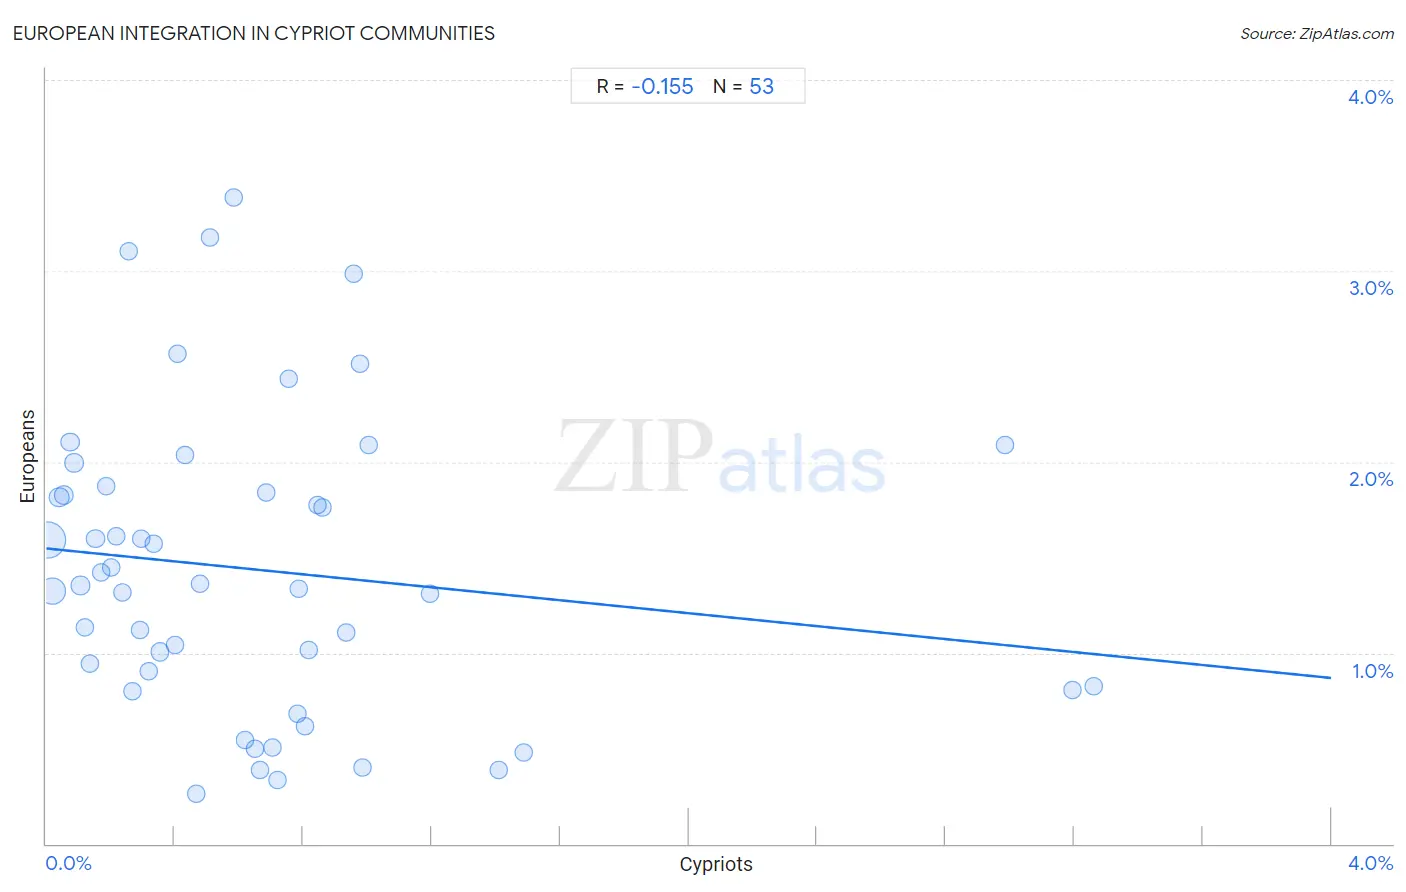
European Integration in Cypriot Communities
The statistical analysis conducted on geographies consisting of 61,741,505 people shows a poor negative correlation between the proportion of Europeans within Cypriot communities in the United States with a correlation coefficient (R) of -0.155. On average, for every 1% (one percent) increase in Cypriots within a typical geography, there is a decrease of 0.170% in Europeans. To illustrate, in a geography comprising of 100,000 individuals, a rise of 1,000 Cypriots corresponds to a decrease of 169.7 Europeans.
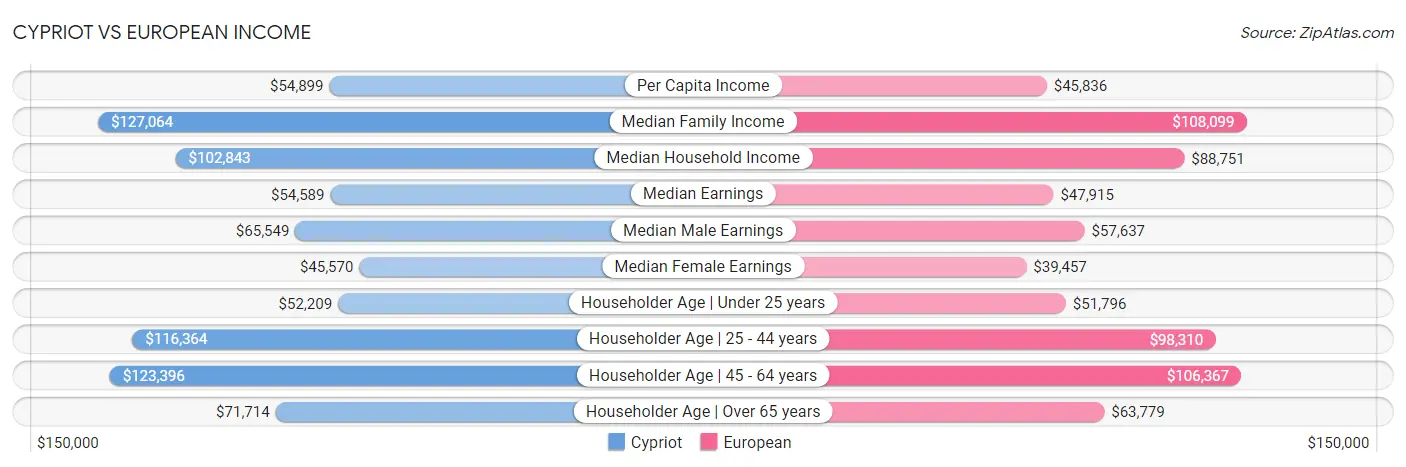
Cypriot vs European Income
When considering income, the most significant differences between Cypriot and European communities in the United States are seen in per capita income ($54,899 compared to $45,836, a difference of 19.8%), householder income ages 25 - 44 years ($116,364 compared to $98,310, a difference of 18.4%), and median family income ($127,064 compared to $108,099, a difference of 17.5%). Conversely, both communities are more comparable in terms of householder income under 25 years ($52,209 compared to $51,796, a difference of 0.80%), wage/income gap (27.3% compared to 29.4%, a difference of 7.7%), and householder income over 65 years ($71,714 compared to $63,779, a difference of 12.4%).
| Income Metric | Cypriot | European |
| Per Capita Income | Exceptional $54,899 | Exceptional $45,836 |
| Median Family Income | Exceptional $127,064 | Exceptional $108,099 |
| Median Household Income | Exceptional $102,843 | Exceptional $88,751 |
| Median Earnings | Exceptional $54,589 | Excellent $47,915 |
| Median Male Earnings | Exceptional $65,549 | Exceptional $57,637 |
| Median Female Earnings | Exceptional $45,570 | Fair $39,457 |
| Householder Age | Under 25 years | Average $52,209 | Fair $51,796 |
| Householder Age | 25 - 44 years | Exceptional $116,364 | Excellent $98,310 |
| Householder Age | 45 - 64 years | Exceptional $123,396 | Exceptional $106,367 |
| Householder Age | Over 65 years | Exceptional $71,714 | Exceptional $63,779 |
| Wage/Income Gap | Tragic 27.3% | Tragic 29.4% |
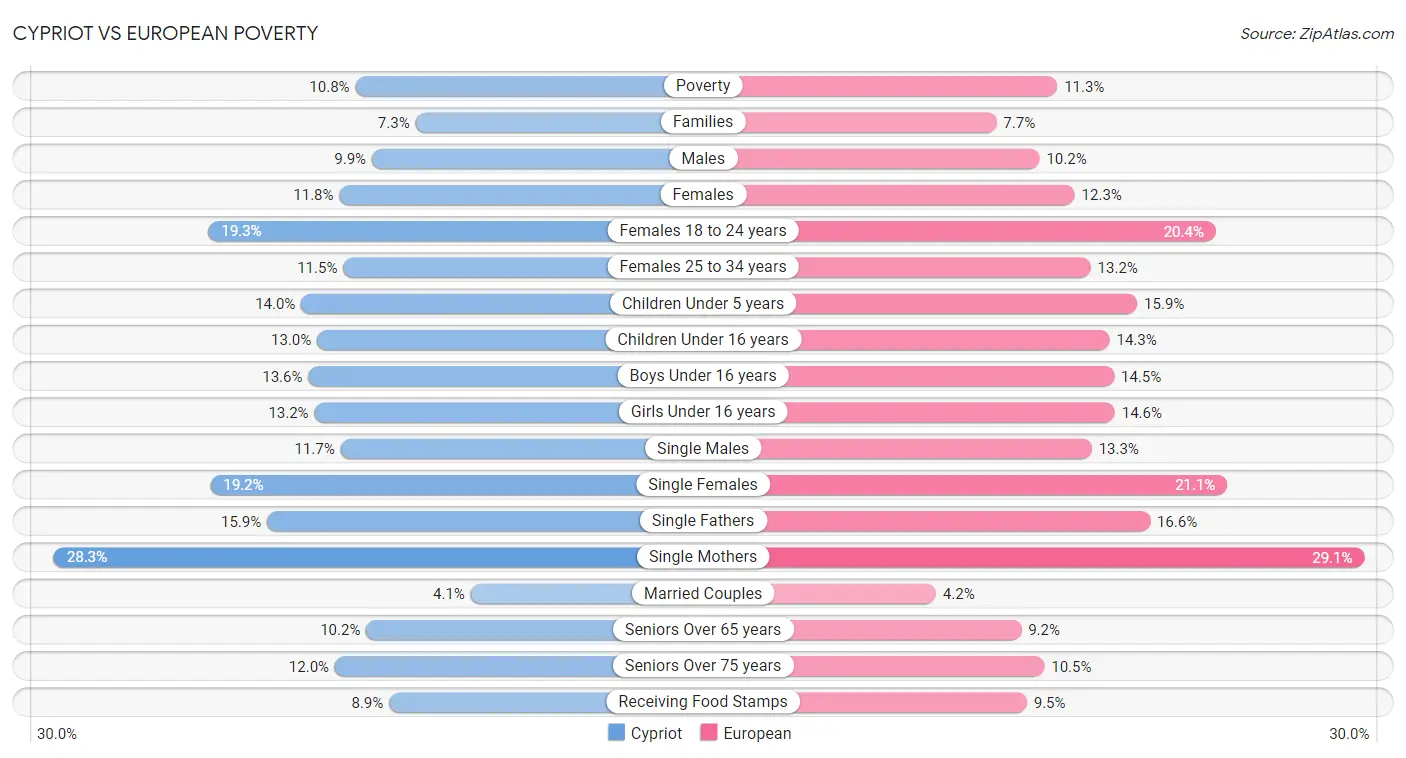
Cypriot vs European Poverty
When considering poverty, the most significant differences between Cypriot and European communities in the United States are seen in female poverty among 25-34 year olds (11.5% compared to 13.2%, a difference of 14.5%), seniors poverty over the age of 75 (12.0% compared to 10.5%, a difference of 14.3%), and child poverty under the age of 5 (14.0% compared to 15.9%, a difference of 13.8%). Conversely, both communities are more comparable in terms of married-couple family poverty (4.1% compared to 4.2%, a difference of 2.0%), single mother poverty (28.3% compared to 29.1%, a difference of 2.7%), and male poverty (9.9% compared to 10.2%, a difference of 3.7%).
| Poverty Metric | Cypriot | European |
| Poverty | Exceptional 10.8% | Exceptional 11.3% |
| Families | Exceptional 7.3% | Exceptional 7.7% |
| Males | Exceptional 9.9% | Exceptional 10.2% |
| Females | Exceptional 11.8% | Exceptional 12.3% |
| Females 18 to 24 years | Exceptional 19.3% | Poor 20.4% |
| Females 25 to 34 years | Exceptional 11.5% | Good 13.2% |
| Children Under 5 years | Exceptional 14.0% | Exceptional 15.9% |
| Children Under 16 years | Exceptional 13.0% | Exceptional 14.3% |
| Boys Under 16 years | Exceptional 13.6% | Exceptional 14.5% |
| Girls Under 16 years | Exceptional 13.2% | Exceptional 14.6% |
| Single Males | Exceptional 11.7% | Tragic 13.3% |
| Single Females | Exceptional 19.2% | Average 21.1% |
| Single Fathers | Excellent 15.9% | Poor 16.6% |
| Single Mothers | Exceptional 28.3% | Average 29.1% |
| Married Couples | Exceptional 4.1% | Exceptional 4.2% |
| Seniors Over 65 years | Exceptional 10.2% | Exceptional 9.2% |
| Seniors Over 75 years | Good 12.0% | Exceptional 10.5% |
| Receiving Food Stamps | Exceptional 8.9% | Exceptional 9.5% |
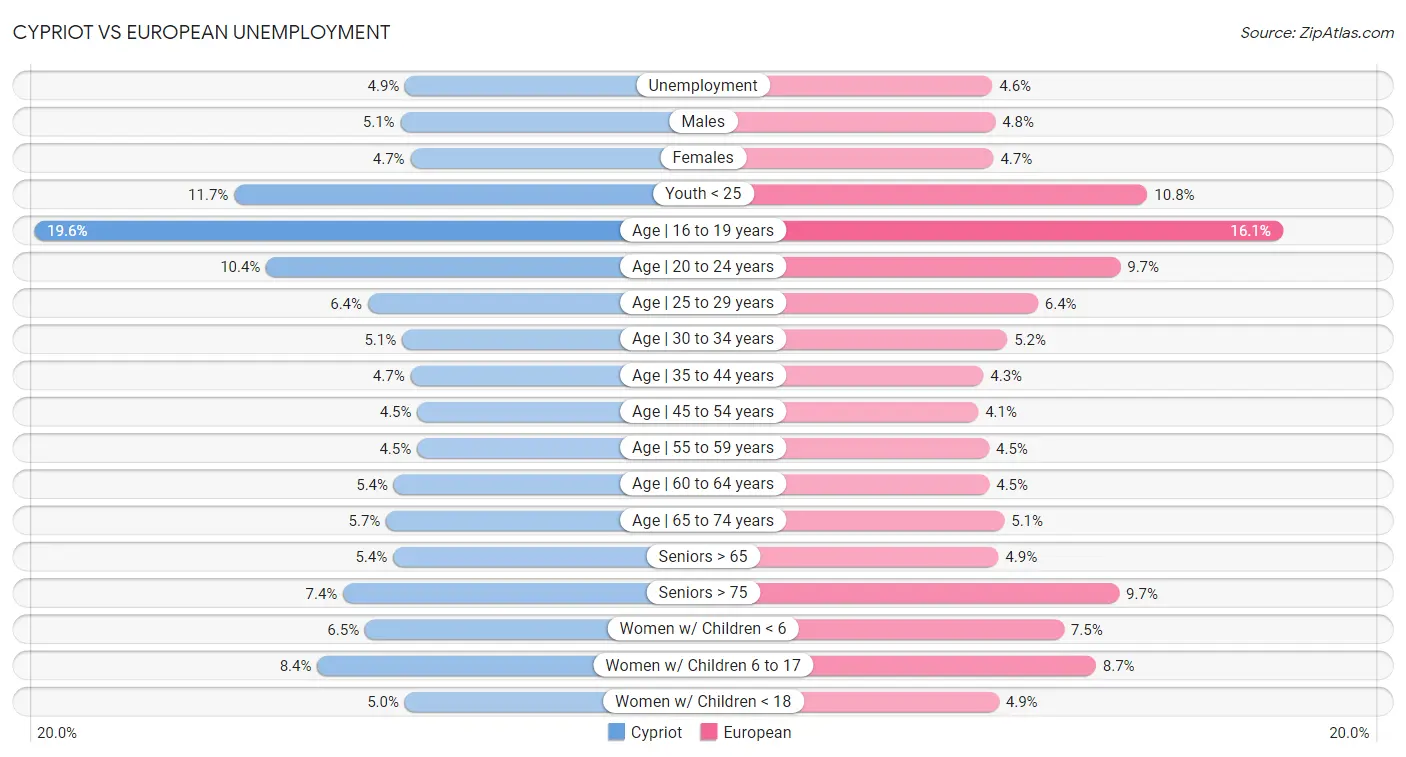
Cypriot vs European Unemployment
When considering unemployment, the most significant differences between Cypriot and European communities in the United States are seen in unemployment among seniors over 75 years (7.4% compared to 9.7%, a difference of 30.5%), unemployment among ages 16 to 19 years (19.6% compared to 16.1%, a difference of 21.7%), and unemployment among ages 60 to 64 years (5.4% compared to 4.5%, a difference of 19.3%). Conversely, both communities are more comparable in terms of unemployment among ages 25 to 29 years (6.4% compared to 6.4%, a difference of 0.36%), unemployment among ages 55 to 59 years (4.5% compared to 4.5%, a difference of 0.87%), and female unemployment (4.7% compared to 4.7%, a difference of 1.1%).
| Unemployment Metric | Cypriot | European |
| Unemployment | Exceptional 4.9% | Exceptional 4.6% |
| Males | Excellent 5.1% | Exceptional 4.8% |
| Females | Exceptional 4.7% | Exceptional 4.7% |
| Youth < 25 | Fair 11.7% | Exceptional 10.8% |
| Age | 16 to 19 years | Tragic 19.6% | Exceptional 16.1% |
| Age | 20 to 24 years | Poor 10.4% | Exceptional 9.7% |
| Age | 25 to 29 years | Exceptional 6.4% | Excellent 6.4% |
| Age | 30 to 34 years | Exceptional 5.1% | Exceptional 5.2% |
| Age | 35 to 44 years | Fair 4.7% | Exceptional 4.3% |
| Age | 45 to 54 years | Good 4.5% | Exceptional 4.1% |
| Age | 55 to 59 years | Exceptional 4.5% | Exceptional 4.5% |
| Age | 60 to 64 years | Tragic 5.4% | Exceptional 4.5% |
| Age | 65 to 74 years | Tragic 5.7% | Exceptional 5.1% |
| Seniors > 65 | Tragic 5.4% | Exceptional 4.9% |
| Seniors > 75 | Exceptional 7.4% | Tragic 9.7% |
| Women w/ Children < 6 | Exceptional 6.5% | Good 7.5% |
| Women w/ Children 6 to 17 | Exceptional 8.4% | Exceptional 8.7% |
| Women w/ Children < 18 | Exceptional 5.0% | Exceptional 4.9% |
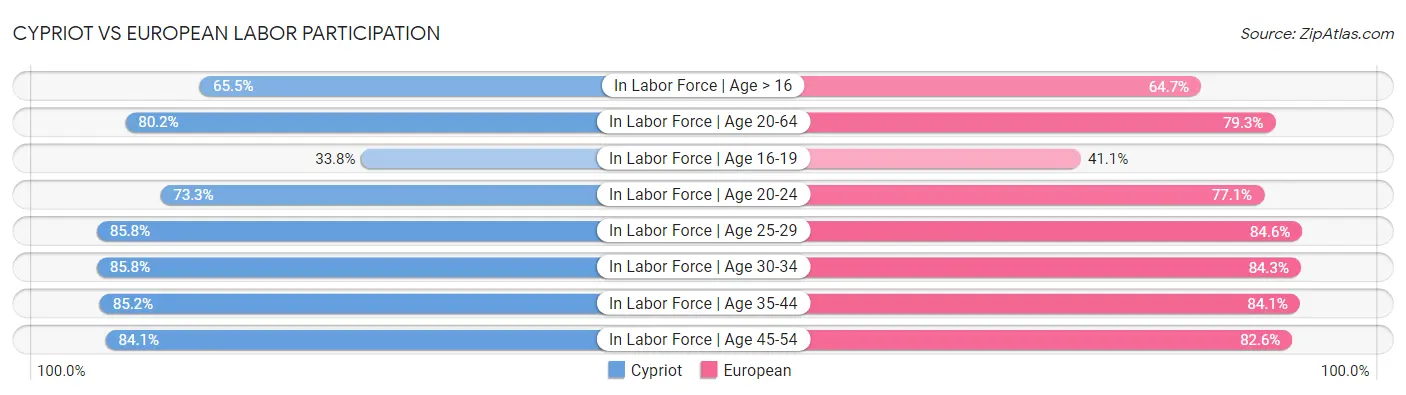
Cypriot vs European Labor Participation
When considering labor participation, the most significant differences between Cypriot and European communities in the United States are seen in in labor force | age 16-19 (33.8% compared to 41.1%, a difference of 21.6%), in labor force | age 20-24 (73.3% compared to 77.1%, a difference of 5.1%), and in labor force | age 30-34 (85.8% compared to 84.3%, a difference of 1.8%). Conversely, both communities are more comparable in terms of in labor force | age 20-64 (80.2% compared to 79.3%, a difference of 1.1%), in labor force | age > 16 (65.5% compared to 64.7%, a difference of 1.2%), and in labor force | age 35-44 (85.2% compared to 84.1%, a difference of 1.3%).
| Labor Participation Metric | Cypriot | European |
| In Labor Force | Age > 16 | Excellent 65.5% | Tragic 64.7% |
| In Labor Force | Age 20-64 | Exceptional 80.2% | Poor 79.3% |
| In Labor Force | Age 16-19 | Tragic 33.8% | Exceptional 41.1% |
| In Labor Force | Age 20-24 | Tragic 73.3% | Exceptional 77.1% |
| In Labor Force | Age 25-29 | Exceptional 85.8% | Average 84.6% |
| In Labor Force | Age 30-34 | Exceptional 85.8% | Tragic 84.3% |
| In Labor Force | Age 35-44 | Exceptional 85.2% | Poor 84.1% |
| In Labor Force | Age 45-54 | Exceptional 84.1% | Fair 82.6% |
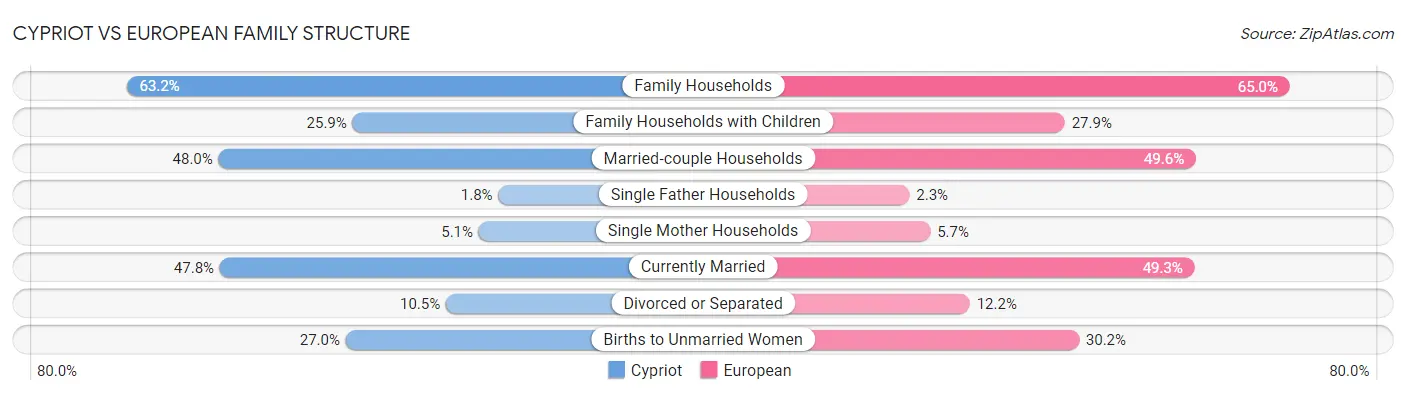
Cypriot vs European Family Structure
When considering family structure, the most significant differences between Cypriot and European communities in the United States are seen in single father households (1.8% compared to 2.3%, a difference of 23.6%), divorced or separated (10.5% compared to 12.2%, a difference of 16.7%), and single mother households (5.1% compared to 5.7%, a difference of 12.7%). Conversely, both communities are more comparable in terms of average family size (3.14 compared to 3.14, a difference of 0.060%), family households (63.2% compared to 65.0%, a difference of 2.9%), and married-couple households (48.0% compared to 49.6%, a difference of 3.2%).
| Family Structure Metric | Cypriot | European |
| Family Households | Tragic 63.2% | Exceptional 65.0% |
| Family Households with Children | Tragic 25.9% | Exceptional 27.9% |
| Married-couple Households | Exceptional 48.0% | Exceptional 49.6% |
| Average Family Size | Tragic 3.14 | Tragic 3.14 |
| Single Father Households | Exceptional 1.8% | Excellent 2.3% |
| Single Mother Households | Exceptional 5.1% | Exceptional 5.7% |
| Currently Married | Exceptional 47.8% | Exceptional 49.3% |
| Divorced or Separated | Exceptional 10.5% | Poor 12.2% |
| Births to Unmarried Women | Exceptional 27.0% | Excellent 30.2% |
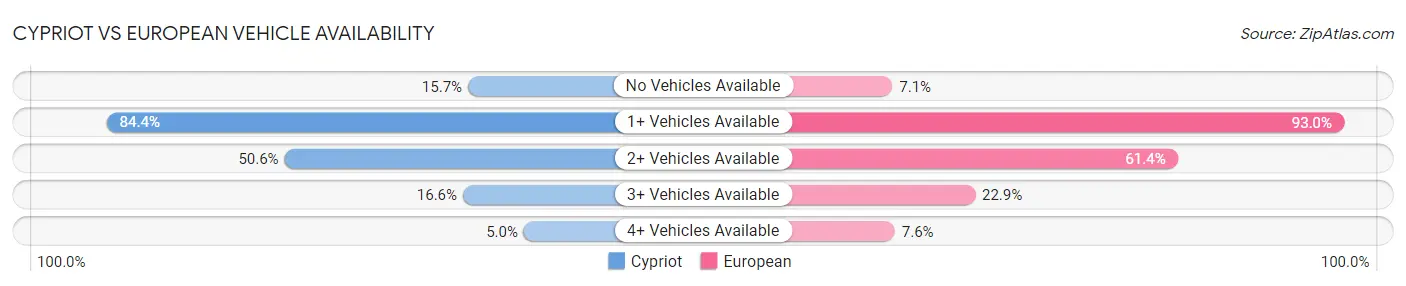
Cypriot vs European Vehicle Availability
When considering vehicle availability, the most significant differences between Cypriot and European communities in the United States are seen in no vehicles in household (15.7% compared to 7.1%, a difference of 120.1%), 4 or more vehicles in household (5.0% compared to 7.6%, a difference of 51.0%), and 3 or more vehicles in household (16.6% compared to 22.9%, a difference of 37.5%). Conversely, both communities are more comparable in terms of 1 or more vehicles in household (84.4% compared to 93.0%, a difference of 10.2%), 2 or more vehicles in household (50.6% compared to 61.4%, a difference of 21.3%), and 3 or more vehicles in household (16.6% compared to 22.9%, a difference of 37.5%).
| Vehicle Availability Metric | Cypriot | European |
| No Vehicles Available | Tragic 15.7% | Exceptional 7.1% |
| 1+ Vehicles Available | Tragic 84.4% | Exceptional 93.0% |
| 2+ Vehicles Available | Tragic 50.6% | Exceptional 61.4% |
| 3+ Vehicles Available | Tragic 16.6% | Exceptional 22.9% |
| 4+ Vehicles Available | Tragic 5.0% | Exceptional 7.6% |
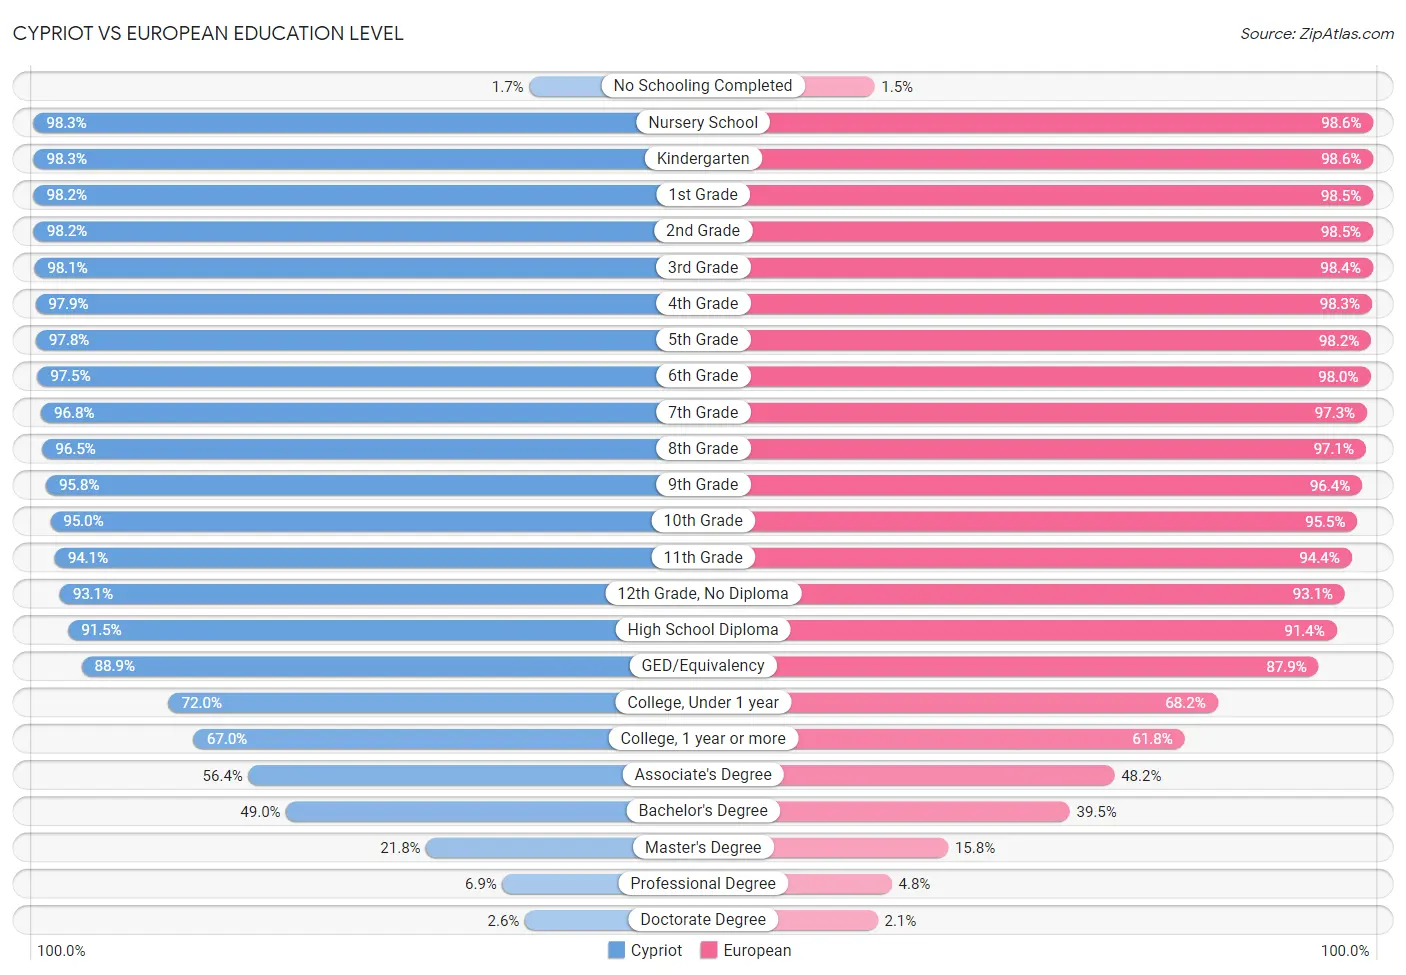
Cypriot vs European Education Level
When considering education level, the most significant differences between Cypriot and European communities in the United States are seen in professional degree (6.9% compared to 4.8%, a difference of 43.8%), master's degree (21.8% compared to 15.8%, a difference of 37.9%), and bachelor's degree (49.0% compared to 39.5%, a difference of 24.3%). Conversely, both communities are more comparable in terms of high school diploma (91.5% compared to 91.4%, a difference of 0.050%), 12th grade, no diploma (93.1% compared to 93.1%, a difference of 0.080%), and 11th grade (94.1% compared to 94.4%, a difference of 0.26%).
| Education Level Metric | Cypriot | European |
| No Schooling Completed | Exceptional 1.7% | Exceptional 1.5% |
| Nursery School | Exceptional 98.3% | Exceptional 98.6% |
| Kindergarten | Exceptional 98.3% | Exceptional 98.6% |
| 1st Grade | Exceptional 98.2% | Exceptional 98.5% |
| 2nd Grade | Exceptional 98.2% | Exceptional 98.5% |
| 3rd Grade | Exceptional 98.1% | Exceptional 98.4% |
| 4th Grade | Exceptional 97.9% | Exceptional 98.3% |
| 5th Grade | Exceptional 97.8% | Exceptional 98.2% |
| 6th Grade | Exceptional 97.5% | Exceptional 98.0% |
| 7th Grade | Exceptional 96.8% | Exceptional 97.3% |
| 8th Grade | Exceptional 96.5% | Exceptional 97.1% |
| 9th Grade | Exceptional 95.8% | Exceptional 96.4% |
| 10th Grade | Exceptional 95.0% | Exceptional 95.5% |
| 11th Grade | Exceptional 94.1% | Exceptional 94.4% |
| 12th Grade, No Diploma | Exceptional 93.1% | Exceptional 93.1% |
| High School Diploma | Exceptional 91.5% | Exceptional 91.4% |
| GED/Equivalency | Exceptional 88.9% | Exceptional 87.9% |
| College, Under 1 year | Exceptional 72.0% | Exceptional 68.2% |
| College, 1 year or more | Exceptional 67.0% | Exceptional 61.8% |
| Associate's Degree | Exceptional 56.4% | Excellent 48.2% |
| Bachelor's Degree | Exceptional 49.0% | Excellent 39.5% |
| Master's Degree | Exceptional 21.8% | Excellent 15.8% |
| Professional Degree | Exceptional 6.9% | Exceptional 4.8% |
| Doctorate Degree | Exceptional 2.6% | Exceptional 2.1% |
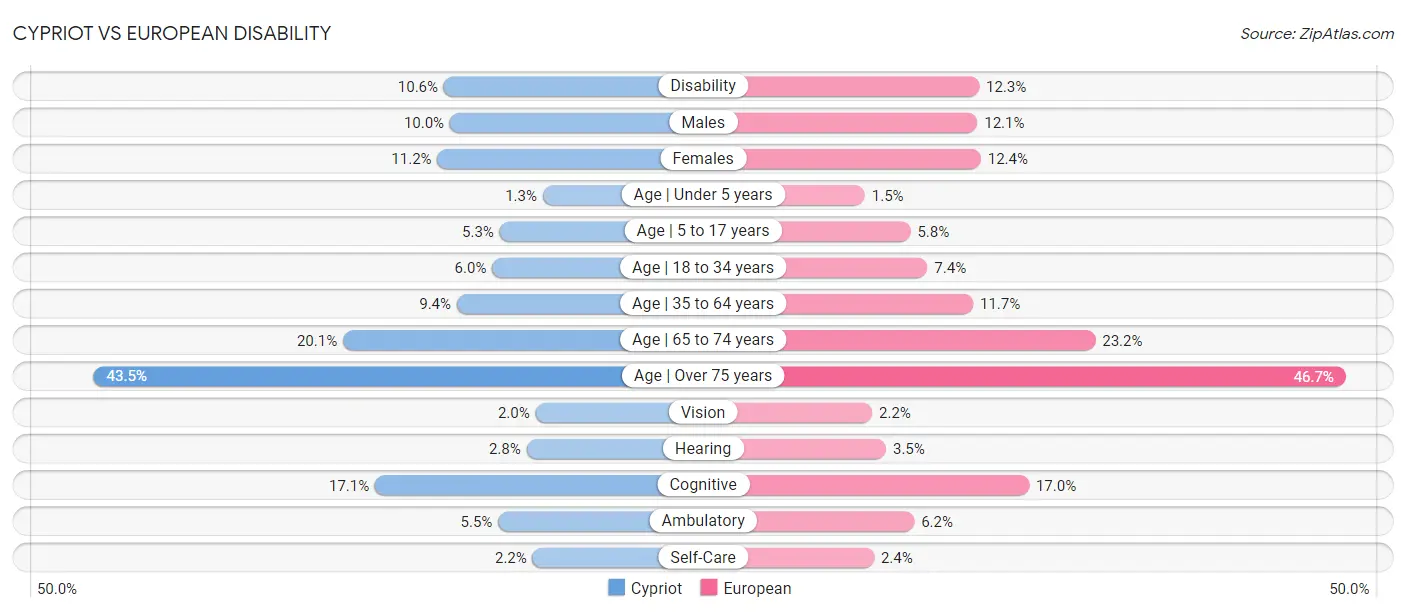
Cypriot vs European Disability
When considering disability, the most significant differences between Cypriot and European communities in the United States are seen in disability age 35 to 64 (9.4% compared to 11.7%, a difference of 24.9%), hearing disability (2.8% compared to 3.5%, a difference of 24.8%), and disability age 18 to 34 (6.0% compared to 7.4%, a difference of 22.5%). Conversely, both communities are more comparable in terms of cognitive disability (17.1% compared to 17.0%, a difference of 0.63%), self-care disability (2.2% compared to 2.4%, a difference of 6.0%), and disability age over 75 (43.5% compared to 46.7%, a difference of 7.4%).
| Disability Metric | Cypriot | European |
| Disability | Exceptional 10.6% | Tragic 12.3% |
| Males | Exceptional 10.0% | Tragic 12.1% |
| Females | Exceptional 11.2% | Poor 12.4% |
| Age | Under 5 years | Poor 1.3% | Tragic 1.5% |
| Age | 5 to 17 years | Exceptional 5.3% | Tragic 5.8% |
| Age | 18 to 34 years | Exceptional 6.0% | Tragic 7.4% |
| Age | 35 to 64 years | Exceptional 9.4% | Poor 11.7% |
| Age | 65 to 74 years | Exceptional 20.1% | Good 23.2% |
| Age | Over 75 years | Exceptional 43.5% | Exceptional 46.7% |
| Vision | Exceptional 2.0% | Fair 2.2% |
| Hearing | Exceptional 2.8% | Tragic 3.5% |
| Cognitive | Excellent 17.1% | Exceptional 17.0% |
| Ambulatory | Exceptional 5.5% | Fair 6.2% |
| Self-Care | Exceptional 2.2% | Exceptional 2.4% |