Zip Codes with the Highest Percentage of Population with a Degree in Psychology in Loveland, CO
RELATED REPORTS & OPTIONS
Psychology
Loveland
Compare Zip Codes
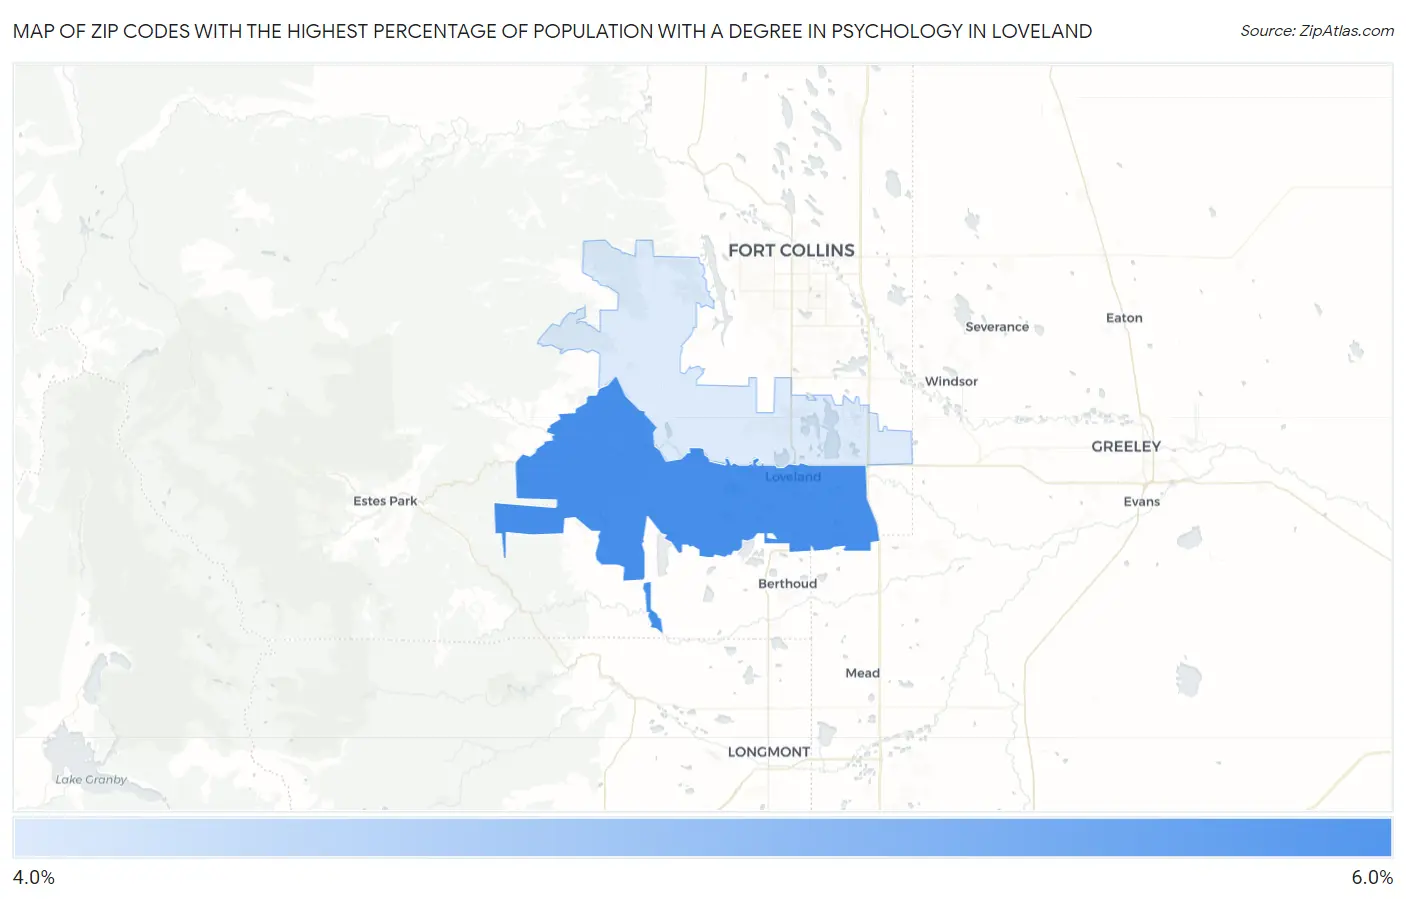
Map of Zip Codes with the Highest Percentage of Population with a Degree in Psychology in Loveland
0.0%
6.0%
Zip Codes with the Highest Percentage of Population with a Degree in Psychology in Loveland, CO
| Zip Code | % Graduates | vs State | vs National | |
| 1. | 80537 | 5.3% | 5.6%(-0.285)#211 | 5.1%(+0.232)#10,215 |
| 2. | 80538 | 4.2% | 5.6%(-1.41)#278 | 5.1%(-0.890)#14,371 |
1
Common Questions
What are the Top Zip Codes with the Highest Percentage of Population with a Degree in Psychology in Loveland, CO?
Top Zip Codes with the Highest Percentage of Population with a Degree in Psychology in Loveland, CO are:
What zip code has the Highest Percentage of Population with a Degree in Psychology in Loveland, CO?
80537 has the Highest Percentage of Population with a Degree in Psychology in Loveland, CO with 5.3%.
What is the Percentage of Population with a Degree in Psychology in Loveland, CO?
Percentage of Population with a Degree in Psychology in Loveland is 4.6%.
What is the Percentage of Population with a Degree in Psychology in Colorado?
Percentage of Population with a Degree in Psychology in Colorado is 5.6%.
What is the Percentage of Population with a Degree in Psychology in the United States?
Percentage of Population with a Degree in Psychology in the United States is 5.1%.