Zip Codes with the Highest Percentage of Population Employed in Mining, Quarrying, & Extraction in Loveland, CO
RELATED REPORTS & OPTIONS
Mining, Quarrying, & Extraction
Loveland
Compare Zip Codes
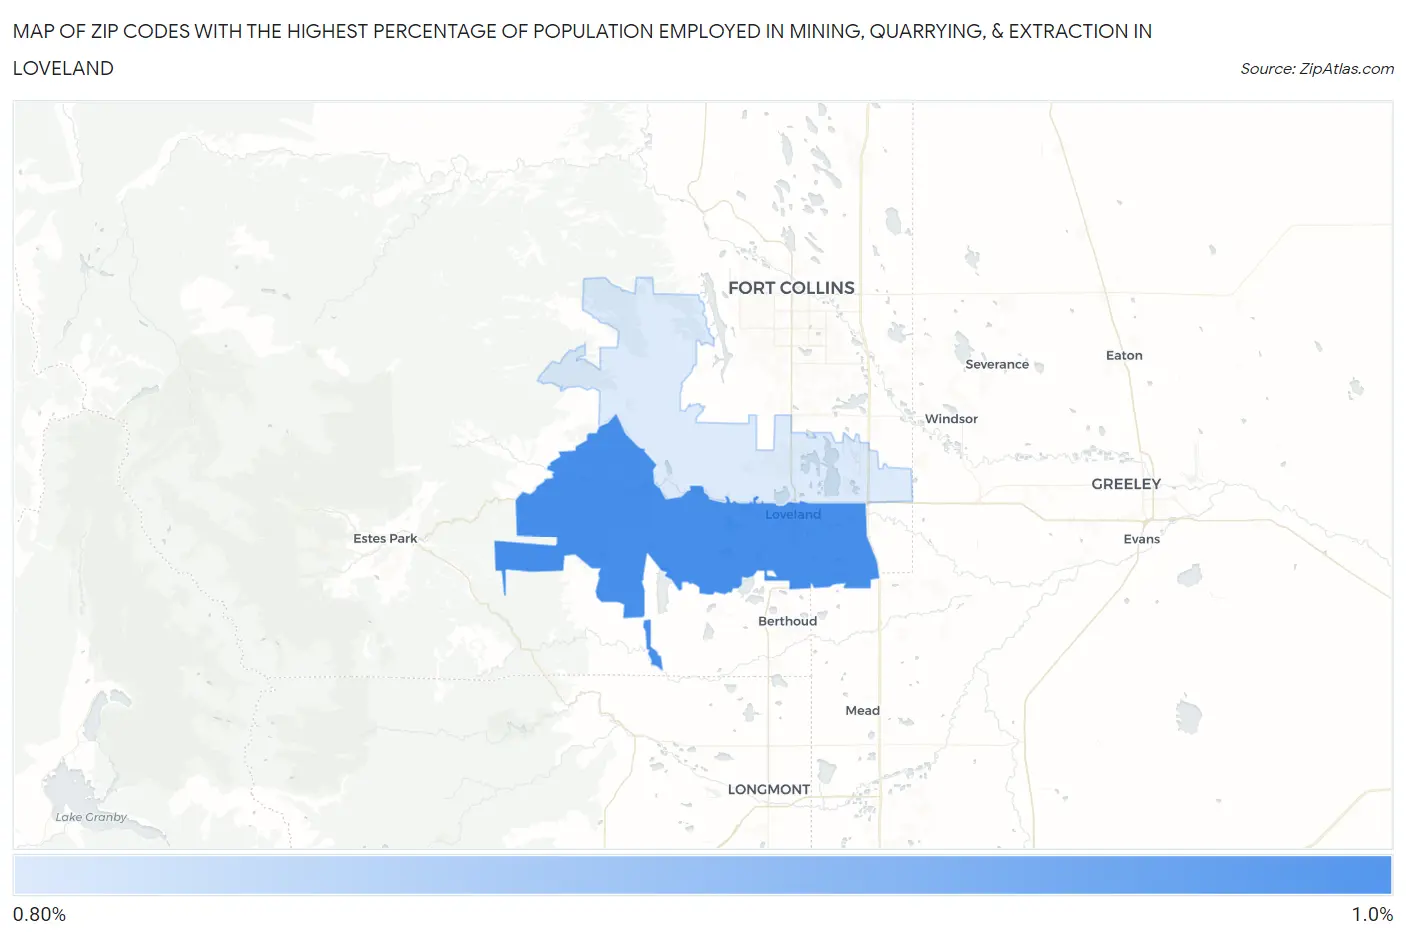
Map of Zip Codes with the Highest Percentage of Population Employed in Mining, Quarrying, & Extraction in Loveland
0.0%
1.0%
Zip Codes with the Highest Percentage of Population Employed in Mining, Quarrying, & Extraction in Loveland, CO
| Zip Code | % Employed | vs State | vs National | |
| 1. | 80537 | 0.91% | 0.87%(+0.037)#165 | 0.44%(+0.466)#5,634 |
| 2. | 80538 | 0.87% | 0.87%(-0.003)#169 | 0.44%(+0.425)#5,751 |
1
Common Questions
What are the Top Zip Codes with the Highest Percentage of Population Employed in Mining, Quarrying, & Extraction in Loveland, CO?
Top Zip Codes with the Highest Percentage of Population Employed in Mining, Quarrying, & Extraction in Loveland, CO are:
What zip code has the Highest Percentage of Population Employed in Mining, Quarrying, & Extraction in Loveland, CO?
80537 has the Highest Percentage of Population Employed in Mining, Quarrying, & Extraction in Loveland, CO with 0.91%.
What is the Percentage of Population Employed in Mining, Quarrying, & Extraction in Loveland, CO?
Percentage of Population Employed in Mining, Quarrying, & Extraction in Loveland is 0.86%.
What is the Percentage of Population Employed in Mining, Quarrying, & Extraction in Colorado?
Percentage of Population Employed in Mining, Quarrying, & Extraction in Colorado is 0.87%.
What is the Percentage of Population Employed in Mining, Quarrying, & Extraction in the United States?
Percentage of Population Employed in Mining, Quarrying, & Extraction in the United States is 0.44%.