West Pleasant View, CO
West Pleasant View Map
West Pleasant View Overview
5,197
TOTAL POPULATION
2,654
MALE POPULATION
2,543
FEMALE POPULATION
104.36
MALES / 100 FEMALES
95.82
FEMALES / 100 MALES
32.0
MEDIAN AGE
2.9
AVG FAMILY SIZE
2.7
AVG HOUSEHOLD SIZE
$33,751
PER CAPITA INCOME
$71,538
AVG FAMILY INCOME
$84,839
AVG HOUSEHOLD INCOME
58.1%
WAGE / INCOME GAP [ % ]
41.9¢/ $1
WAGE / INCOME GAP [ $ ]
0.38
INEQUALITY / GINI INDEX
2,800
LABOR FORCE [ PEOPLE ]
65.6%
PERCENT IN LABOR FORCE
5.4%
UNEMPLOYMENT RATE
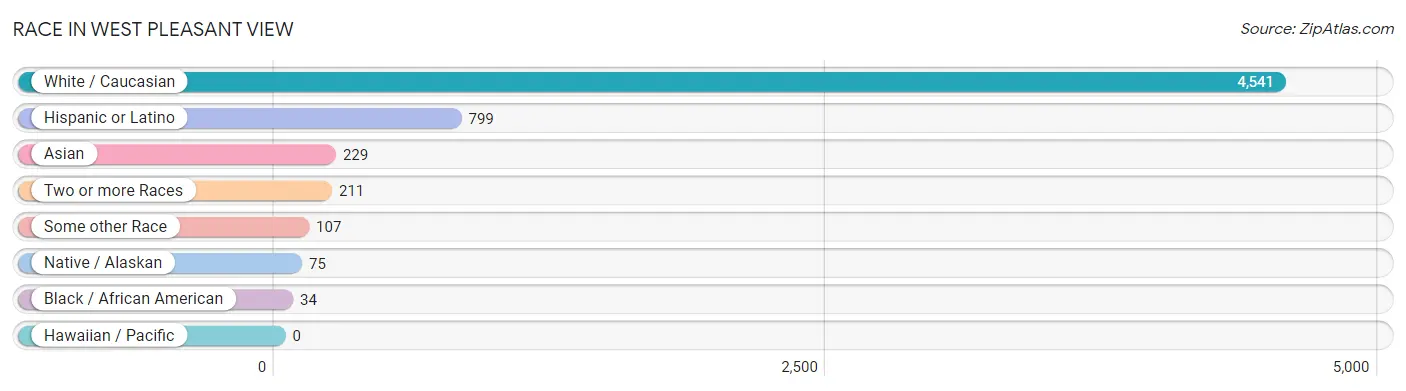
Race in West Pleasant View
The most populous races in West Pleasant View are White / Caucasian (4,541 | 87.4%), Hispanic or Latino (799 | 15.4%), and Asian (229 | 4.4%).
| Race | # Population | % Population |
| Asian | 229 | 4.4% |
| Black / African American | 34 | 0.6% |
| Hawaiian / Pacific | 0 | 0.0% |
| Hispanic or Latino | 799 | 15.4% |
| Native / Alaskan | 75 | 1.4% |
| White / Caucasian | 4,541 | 87.4% |
| Two or more Races | 211 | 4.1% |
| Some other Race | 107 | 2.1% |
| Total | 5,197 | 100.0% |
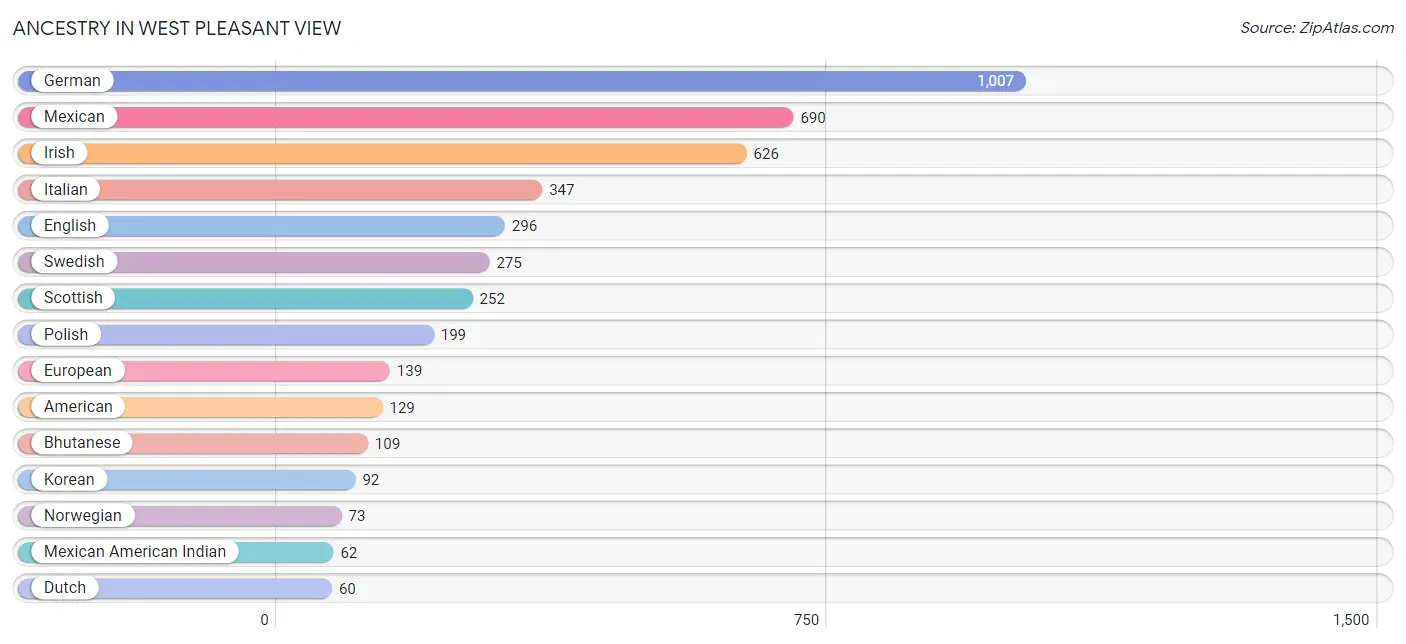
Ancestry in West Pleasant View
The most populous ancestries reported in West Pleasant View are German (1,007 | 19.4%), Mexican (690 | 13.3%), Irish (626 | 12.0%), Italian (347 | 6.7%), and English (296 | 5.7%), together accounting for 57.1% of all West Pleasant View residents.
| Ancestry | # Population | % Population |
| African | 2 | 0.0% |
| American | 129 | 2.5% |
| Belgian | 17 | 0.3% |
| Bhutanese | 109 | 2.1% |
| British | 20 | 0.4% |
| Burmese | 55 | 1.1% |
| Central American | 12 | 0.2% |
| Cherokee | 18 | 0.4% |
| Czech | 16 | 0.3% |
| Dutch | 60 | 1.1% |
| Eastern European | 14 | 0.3% |
| English | 296 | 5.7% |
| European | 139 | 2.7% |
| French | 59 | 1.1% |
| French Canadian | 40 | 0.8% |
| German | 1,007 | 19.4% |
| Indian (Asian) | 14 | 0.3% |
| Irish | 626 | 12.0% |
| Italian | 347 | 6.7% |
| Korean | 92 | 1.8% |
| Lithuanian | 17 | 0.3% |
| Mexican | 690 | 13.3% |
| Mexican American Indian | 62 | 1.2% |
| Norwegian | 73 | 1.4% |
| Polish | 199 | 3.8% |
| Scandinavian | 20 | 0.4% |
| Scottish | 252 | 4.9% |
| Slovak | 22 | 0.4% |
| Spaniard | 10 | 0.2% |
| Spanish | 26 | 0.5% |
| Subsaharan African | 2 | 0.0% |
| Swedish | 275 | 5.3% |
| Welsh | 32 | 0.6% | View All 33 Rows |
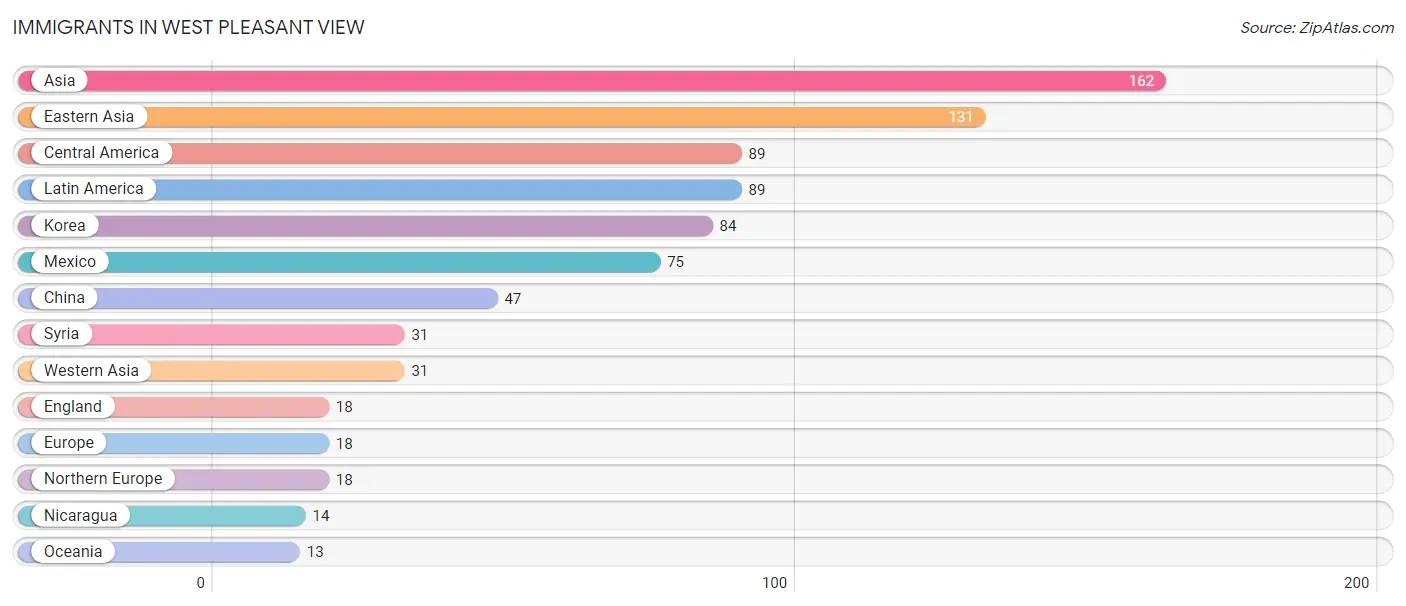
Immigrants in West Pleasant View
The most numerous immigrant groups reported in West Pleasant View came from Asia (162 | 3.1%), Eastern Asia (131 | 2.5%), Central America (89 | 1.7%), Latin America (89 | 1.7%), and Korea (84 | 1.6%), together accounting for 10.7% of all West Pleasant View residents.
| Immigration Origin | # Population | % Population |
| Asia | 162 | 3.1% |
| Central America | 89 | 1.7% |
| China | 47 | 0.9% |
| Eastern Asia | 131 | 2.5% |
| England | 18 | 0.4% |
| Europe | 18 | 0.4% |
| Korea | 84 | 1.6% |
| Latin America | 89 | 1.7% |
| Mexico | 75 | 1.4% |
| Nicaragua | 14 | 0.3% |
| Northern Europe | 18 | 0.4% |
| Oceania | 13 | 0.3% |
| Syria | 31 | 0.6% |
| Western Asia | 31 | 0.6% | View All 14 Rows |
Sex and Age in West Pleasant View
Sex and Age in West Pleasant View
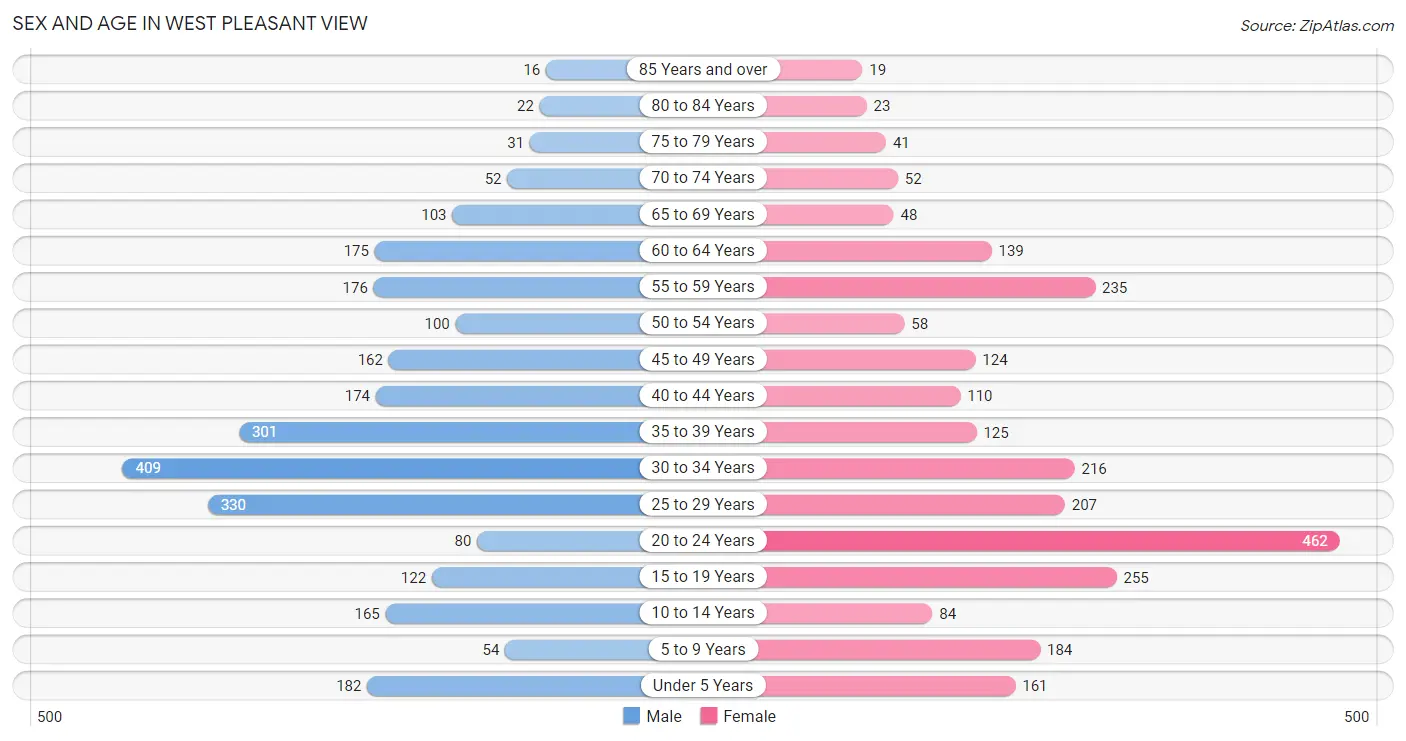
The most populous age groups in West Pleasant View are 30 to 34 Years (409 | 15.4%) for men and 20 to 24 Years (462 | 18.2%) for women.
| Age Bracket | Male | Female |
| Under 5 Years | 182 (6.9%) | 161 (6.3%) |
| 5 to 9 Years | 54 (2.0%) | 184 (7.2%) |
| 10 to 14 Years | 165 (6.2%) | 84 (3.3%) |
| 15 to 19 Years | 122 (4.6%) | 255 (10.0%) |
| 20 to 24 Years | 80 (3.0%) | 462 (18.2%) |
| 25 to 29 Years | 330 (12.4%) | 207 (8.1%) |
| 30 to 34 Years | 409 (15.4%) | 216 (8.5%) |
| 35 to 39 Years | 301 (11.3%) | 125 (4.9%) |
| 40 to 44 Years | 174 (6.6%) | 110 (4.3%) |
| 45 to 49 Years | 162 (6.1%) | 124 (4.9%) |
| 50 to 54 Years | 100 (3.8%) | 58 (2.3%) |
| 55 to 59 Years | 176 (6.6%) | 235 (9.2%) |
| 60 to 64 Years | 175 (6.6%) | 139 (5.5%) |
| 65 to 69 Years | 103 (3.9%) | 48 (1.9%) |
| 70 to 74 Years | 52 (2.0%) | 52 (2.0%) |
| 75 to 79 Years | 31 (1.2%) | 41 (1.6%) |
| 80 to 84 Years | 22 (0.8%) | 23 (0.9%) |
| 85 Years and over | 16 (0.6%) | 19 (0.7%) |
| Total | 2,654 (100.0%) | 2,543 (100.0%) |
Families and Households in West Pleasant View
Median Family Size in West Pleasant View
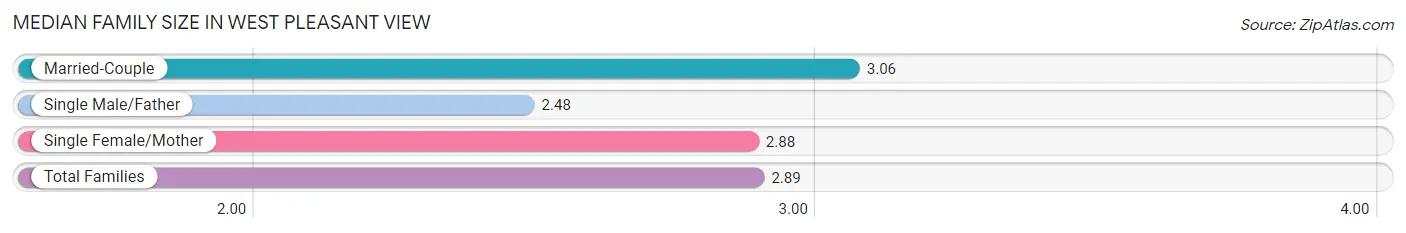
The median family size in West Pleasant View is 2.89 persons per family, with married-couple families (652 | 58.1%) accounting for the largest median family size of 3.06 persons per family. On the other hand, single male/father families (275 | 24.5%) represent the smallest median family size with 2.48 persons per family.
| Family Type | # Families | Family Size |
| Married-Couple | 652 (58.1%) | 3.06 |
| Single Male/Father | 275 (24.5%) | 2.48 |
| Single Female/Mother | 196 (17.4%) | 2.88 |
| Total Families | 1,123 (100.0%) | 2.89 |
Median Household Size in West Pleasant View
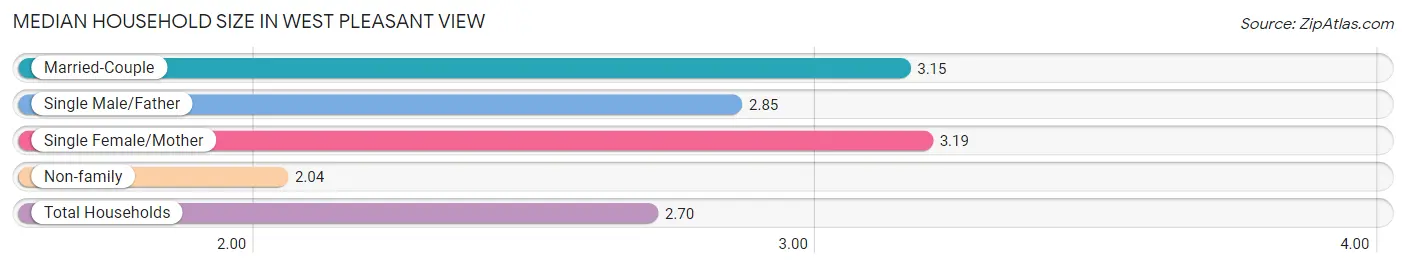
The median household size in West Pleasant View is 2.70 persons per household, with single female/mother households (196 | 11.0%) accounting for the largest median household size of 3.19 persons per household. non-family households (659 | 37.0%) represent the smallest median household size with 2.04 persons per household.
| Household Type | # Households | Household Size |
| Married-Couple | 652 (36.6%) | 3.15 |
| Single Male/Father | 275 (15.4%) | 2.85 |
| Single Female/Mother | 196 (11.0%) | 3.19 |
| Non-family | 659 (37.0%) | 2.04 |
| Total Households | 1,782 (100.0%) | 2.70 |
Household Size by Marriage Status in West Pleasant View
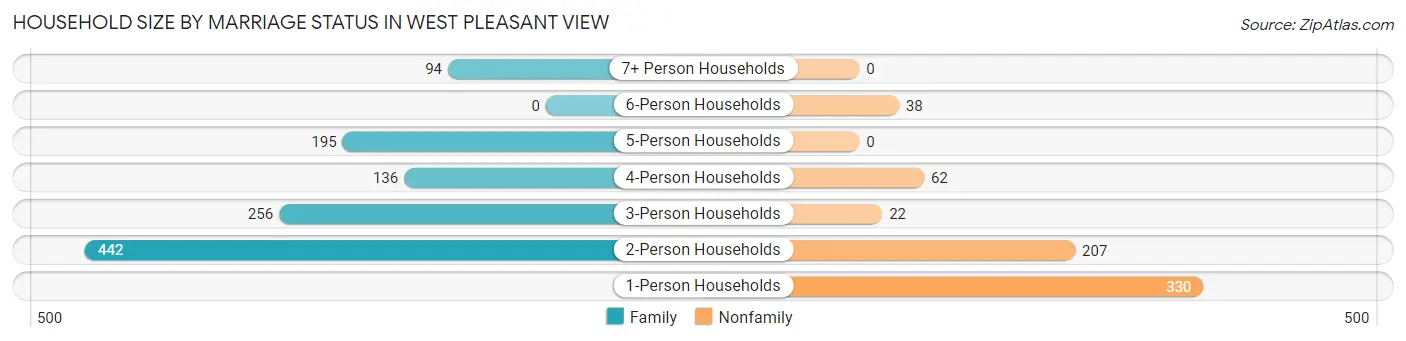
Out of a total of 1,782 households in West Pleasant View, 1,123 (63.0%) are family households, while 659 (37.0%) are nonfamily households. The most numerous type of family households are 2-person households, comprising 442, and the most common type of nonfamily households are 1-person households, comprising 330.
| Household Size | Family Households | Nonfamily Households |
| 1-Person Households | - | 330 (18.5%) |
| 2-Person Households | 442 (24.8%) | 207 (11.6%) |
| 3-Person Households | 256 (14.4%) | 22 (1.2%) |
| 4-Person Households | 136 (7.6%) | 62 (3.5%) |
| 5-Person Households | 195 (10.9%) | 0 (0.0%) |
| 6-Person Households | 0 (0.0%) | 38 (2.1%) |
| 7+ Person Households | 94 (5.3%) | 0 (0.0%) |
| Total | 1,123 (63.0%) | 659 (37.0%) |
Female Fertility in West Pleasant View
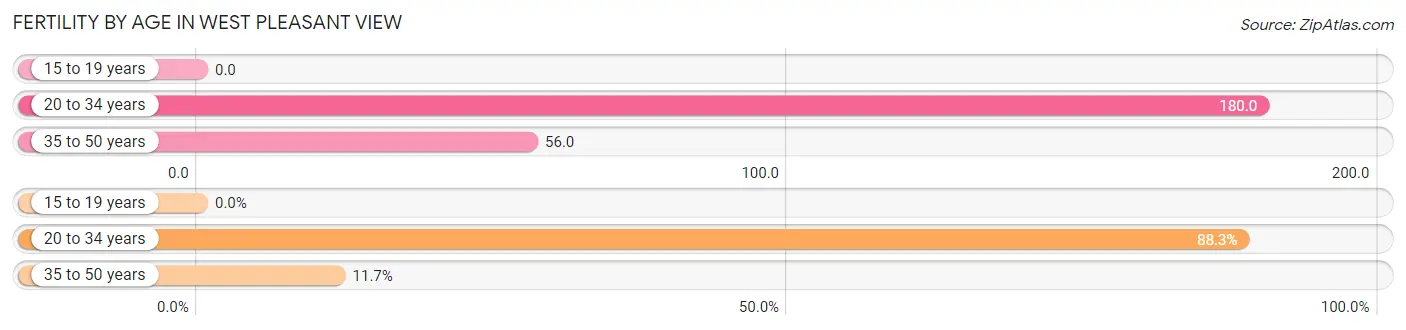
Fertility by Age in West Pleasant View
Average fertility rate in West Pleasant View is 119.0 births per 1,000 women. Women in the age bracket of 20 to 34 years have the highest fertility rate with 180.0 births per 1,000 women. Women in the age bracket of 20 to 34 years acount for 88.3% of all women with births.
| Age Bracket | Women with Births | Births / 1,000 Women |
| 15 to 19 years | 0 (0.0%) | 0.0 |
| 20 to 34 years | 159 (88.3%) | 180.0 |
| 35 to 50 years | 21 (11.7%) | 56.0 |
| Total | 180 (100.0%) | 119.0 |
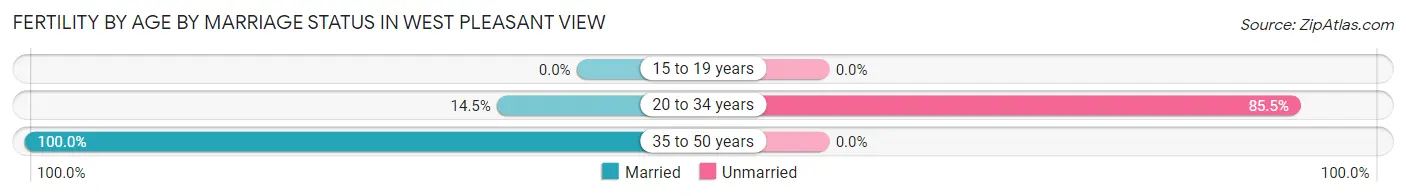
Fertility by Age by Marriage Status in West Pleasant View
24.4% of women with births (180) in West Pleasant View are married. The highest percentage of unmarried women with births falls into 20 to 34 years age bracket with 85.5% of them unmarried at the time of birth, while the lowest percentage of unmarried women with births belong to 35 to 50 years age bracket with 0.0% of them unmarried.
| Age Bracket | Married | Unmarried |
| 15 to 19 years | 0 (0.0%) | 0 (0.0%) |
| 20 to 34 years | 23 (14.5%) | 136 (85.5%) |
| 35 to 50 years | 21 (100.0%) | 0 (0.0%) |
| Total | 44 (24.4%) | 136 (75.6%) |
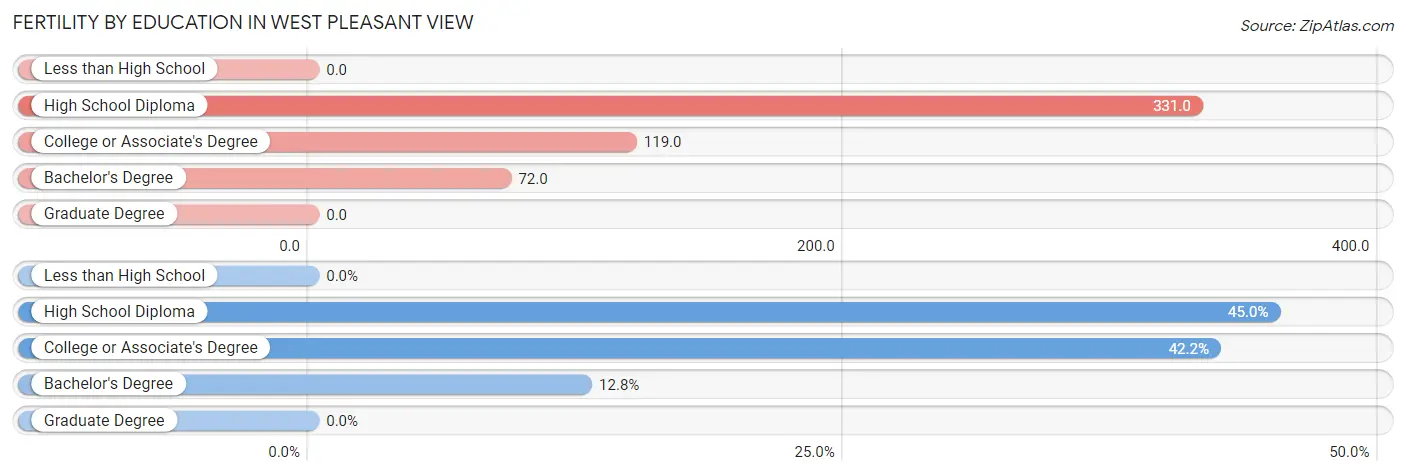
Fertility by Education in West Pleasant View
| Educational Attainment | Women with Births | Births / 1,000 Women |
| Less than High School | 0 (0.0%) | 0.0 |
| High School Diploma | 81 (45.0%) | 331.0 |
| College or Associate's Degree | 76 (42.2%) | 119.0 |
| Bachelor's Degree | 23 (12.8%) | 72.0 |
| Graduate Degree | 0 (0.0%) | 0.0 |
| Total | 180 (100.0%) | 119.0 |
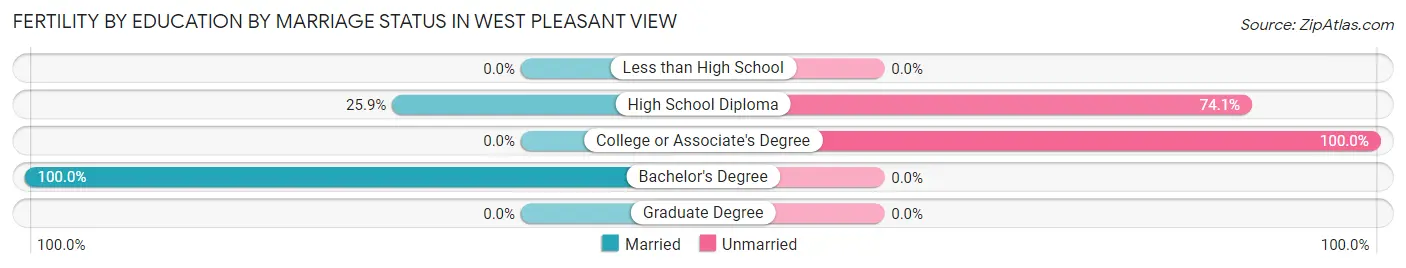
Fertility by Education by Marriage Status in West Pleasant View
75.6% of women with births in West Pleasant View are unmarried. Women with the educational attainment of bachelor's degree are most likely to be married with 100.0% of them married at childbirth, while women with the educational attainment of college or associate's degree are least likely to be married with 100.0% of them unmarried at childbirth.
| Educational Attainment | Married | Unmarried |
| Less than High School | 0 (0.0%) | 0 (0.0%) |
| High School Diploma | 21 (25.9%) | 60 (74.1%) |
| College or Associate's Degree | 0 (0.0%) | 76 (100.0%) |
| Bachelor's Degree | 23 (100.0%) | 0 (0.0%) |
| Graduate Degree | 0 (0.0%) | 0 (0.0%) |
| Total | 44 (24.4%) | 136 (75.6%) |
Income in West Pleasant View
Income Overview in West Pleasant View
Per Capita Income in West Pleasant View is $33,751, while median incomes of families and households are $71,538 and $84,839 respectively.
| Characteristic | Number | Measure |
| Per Capita Income | 5,197 | $33,751 |
| Median Family Income | 1,123 | $71,538 |
| Mean Family Income | 1,123 | $86,542 |
| Median Household Income | 1,782 | $84,839 |
| Mean Household Income | 1,782 | $99,228 |
| Income Deficit | 1,123 | $0 |
| Wage / Income Gap (%) | 5,197 | 58.13% |
| Wage / Income Gap ($) | 5,197 | 41.87¢ per $1 |
| Gini / Inequality Index | 5,197 | 0.38 |
Earnings by Sex in West Pleasant View
Average Earnings in West Pleasant View are $37,361, $56,653 for men and $23,718 for women, a difference of 58.1%.
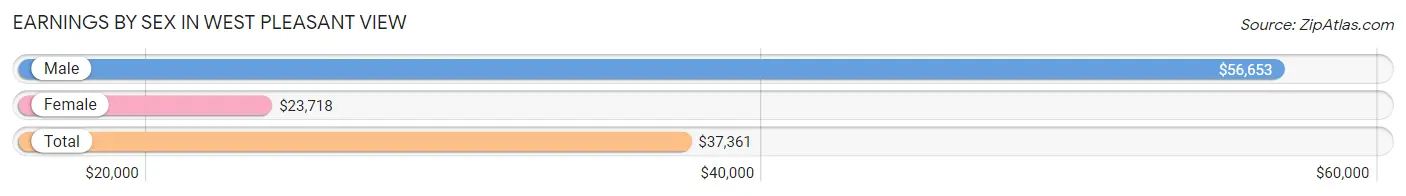
| Sex | Number | Average Earnings |
| Male | 1,543 (50.9%) | $56,653 |
| Female | 1,490 (49.1%) | $23,718 |
| Total | 3,033 (100.0%) | $37,361 |
Earnings by Sex by Income Bracket in West Pleasant View
The most common earnings brackets in West Pleasant View are $100,000+ for men (291 | 18.9%) and $7,500 to $9,999 for women (220 | 14.8%).
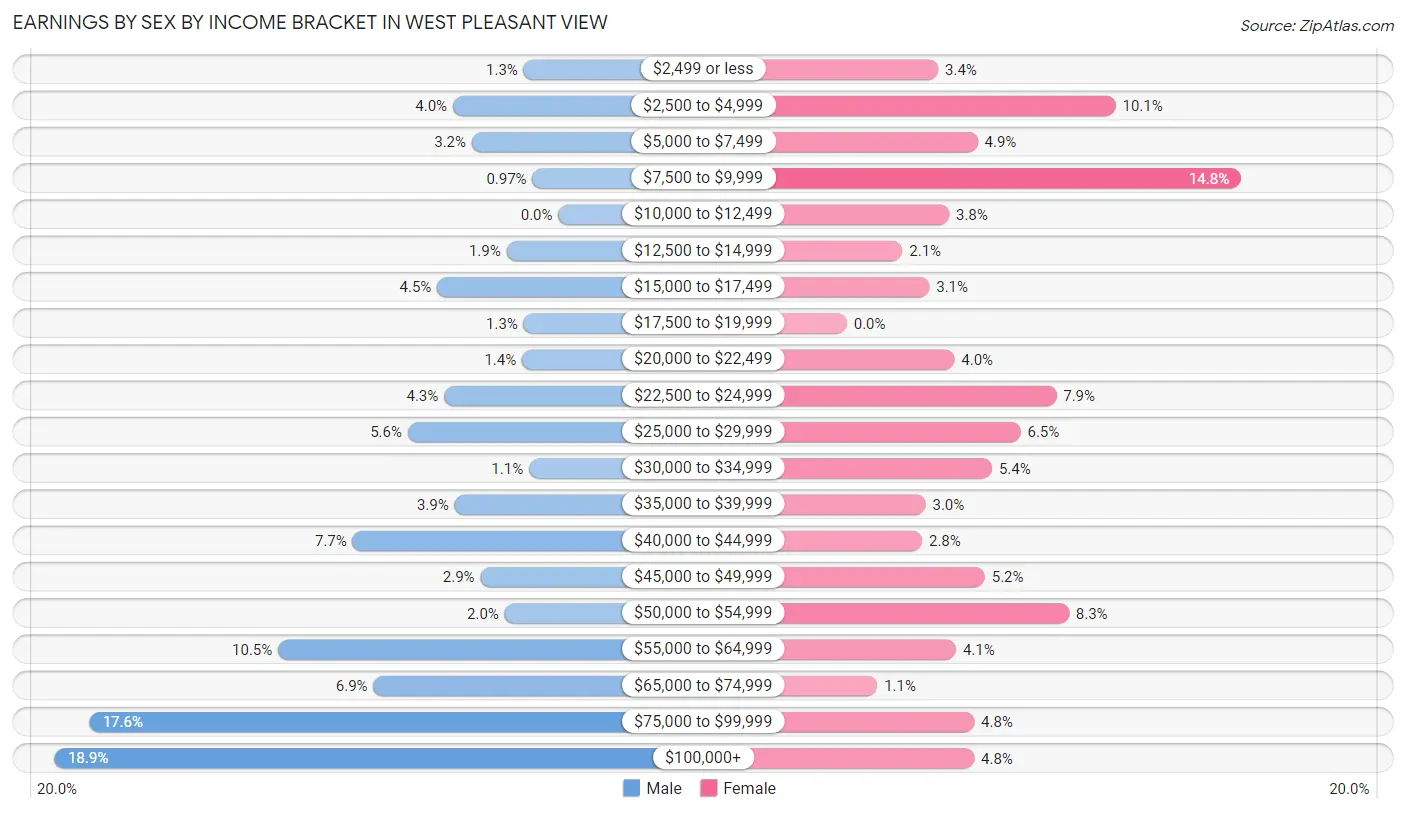
| Income | Male | Female |
| $2,499 or less | 20 (1.3%) | 51 (3.4%) |
| $2,500 to $4,999 | 61 (4.0%) | 150 (10.1%) |
| $5,000 to $7,499 | 50 (3.2%) | 73 (4.9%) |
| $7,500 to $9,999 | 15 (1.0%) | 220 (14.8%) |
| $10,000 to $12,499 | 0 (0.0%) | 57 (3.8%) |
| $12,500 to $14,999 | 30 (1.9%) | 31 (2.1%) |
| $15,000 to $17,499 | 70 (4.5%) | 46 (3.1%) |
| $17,500 to $19,999 | 20 (1.3%) | 0 (0.0%) |
| $20,000 to $22,499 | 21 (1.4%) | 60 (4.0%) |
| $22,500 to $24,999 | 66 (4.3%) | 117 (7.9%) |
| $25,000 to $29,999 | 87 (5.6%) | 97 (6.5%) |
| $30,000 to $34,999 | 17 (1.1%) | 81 (5.4%) |
| $35,000 to $39,999 | 60 (3.9%) | 44 (2.9%) |
| $40,000 to $44,999 | 119 (7.7%) | 42 (2.8%) |
| $45,000 to $49,999 | 45 (2.9%) | 77 (5.2%) |
| $50,000 to $54,999 | 31 (2.0%) | 124 (8.3%) |
| $55,000 to $64,999 | 162 (10.5%) | 61 (4.1%) |
| $65,000 to $74,999 | 107 (6.9%) | 17 (1.1%) |
| $75,000 to $99,999 | 271 (17.6%) | 71 (4.8%) |
| $100,000+ | 291 (18.9%) | 71 (4.8%) |
| Total | 1,543 (100.0%) | 1,490 (100.0%) |
Earnings by Sex by Educational Attainment in West Pleasant View
Average earnings in West Pleasant View are $57,181 for men and $29,884 for women, a difference of 47.7%. Men with an educational attainment of graduate degree enjoy the highest average annual earnings of $98,000, while those with high school diploma education earn the least with $36,438. Women with an educational attainment of bachelor's degree earn the most with the average annual earnings of $52,575, while those with high school diploma education have the smallest earnings of $22,250.
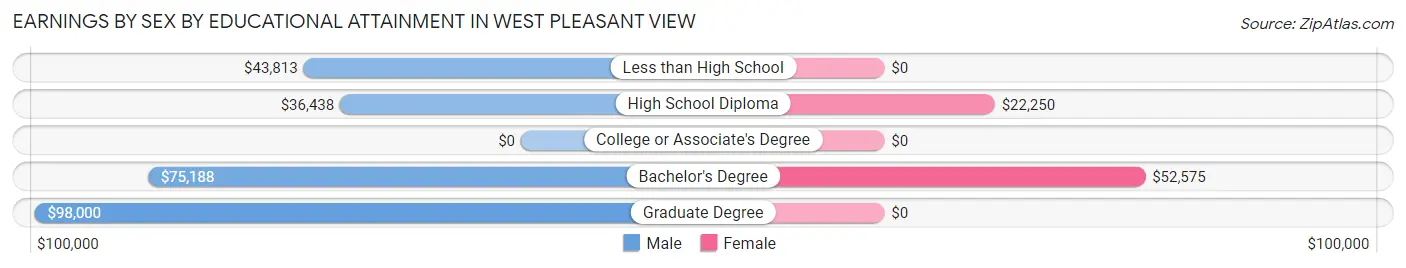
| Educational Attainment | Male Income | Female Income |
| Less than High School | $43,813 | $0 |
| High School Diploma | $36,438 | $22,250 |
| College or Associate's Degree | - | - |
| Bachelor's Degree | $75,188 | $52,575 |
| Graduate Degree | $98,000 | $0 |
| Total | $57,181 | $29,884 |
Family Income in West Pleasant View
Family Income Brackets in West Pleasant View
According to the West Pleasant View family income data, there are 273 families falling into the $50,000 to $74,999 income range, which is the most common income bracket and makes up 24.3% of all families.
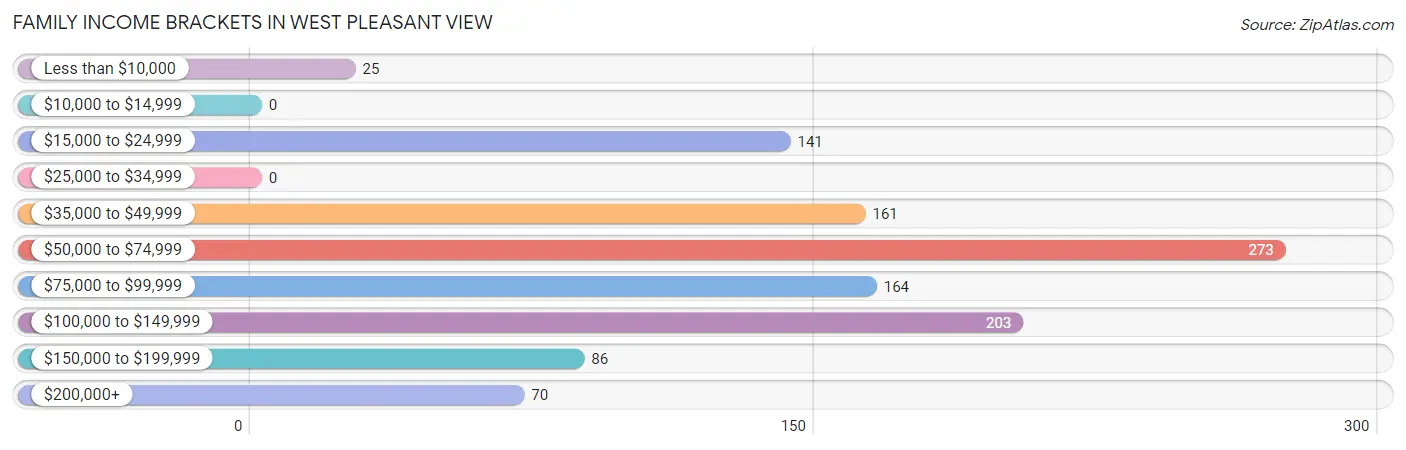
| Income Bracket | # Families | % Families |
| Less than $10,000 | 25 | 2.2% |
| $10,000 to $14,999 | 0 | 0.0% |
| $15,000 to $24,999 | 141 | 12.6% |
| $25,000 to $34,999 | 0 | 0.0% |
| $35,000 to $49,999 | 161 | 14.3% |
| $50,000 to $74,999 | 273 | 24.3% |
| $75,000 to $99,999 | 164 | 14.6% |
| $100,000 to $149,999 | 203 | 18.1% |
| $150,000 to $199,999 | 86 | 7.7% |
| $200,000+ | 70 | 6.2% |
Family Income by Famaliy Size in West Pleasant View
4-person families (257 | 22.9%) account for the highest median family income in West Pleasant View with $87,670 per family, while 2-person families (442 | 39.4%) have the highest median income of $29,853 per family member.
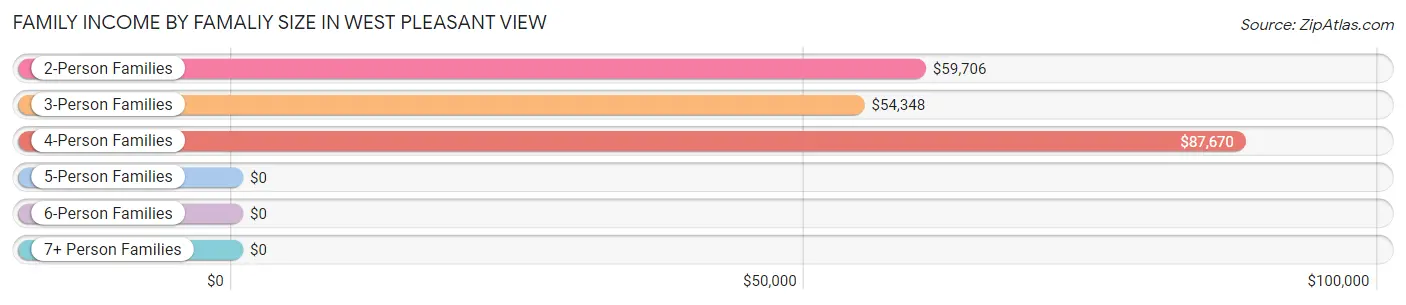
| Income Bracket | # Families | Median Income |
| 2-Person Families | 442 (39.4%) | $59,706 |
| 3-Person Families | 290 (25.8%) | $54,348 |
| 4-Person Families | 257 (22.9%) | $87,670 |
| 5-Person Families | 40 (3.6%) | $0 |
| 6-Person Families | 92 (8.2%) | $0 |
| 7+ Person Families | 2 (0.2%) | $0 |
| Total | 1,123 (100.0%) | $71,538 |
Family Income by Number of Earners in West Pleasant View
The median family income in West Pleasant View is $71,538, with families comprising 3+ earners (54) having the highest median family income of $134,265, while families with 1 earner (438) have the lowest median family income of $57,111, accounting for 4.8% and 39.0% of families, respectively.
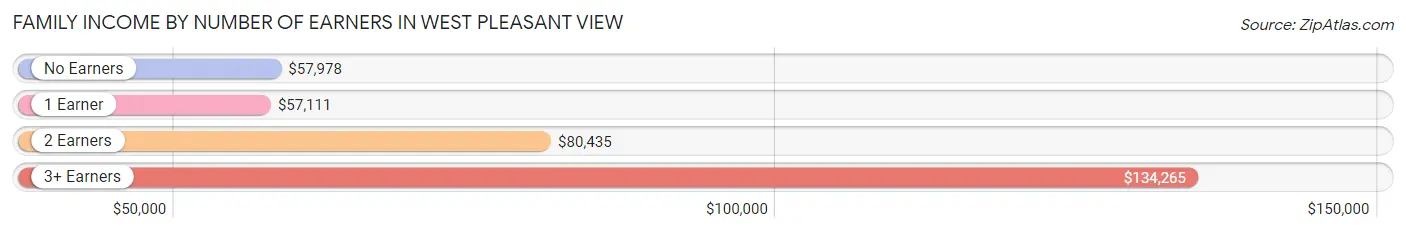
| Number of Earners | # Families | Median Income |
| No Earners | 109 (9.7%) | $57,978 |
| 1 Earner | 438 (39.0%) | $57,111 |
| 2 Earners | 522 (46.5%) | $80,435 |
| 3+ Earners | 54 (4.8%) | $134,265 |
| Total | 1,123 (100.0%) | $71,538 |
Household Income in West Pleasant View
Household Income Brackets in West Pleasant View
With 374 households falling in the category, the $100,000 to $149,999 income range is the most frequent in West Pleasant View, accounting for 21.0% of all households. In contrast, only 32 households (1.8%) fall into the $10,000 to $14,999 income bracket, making it the least populous group.
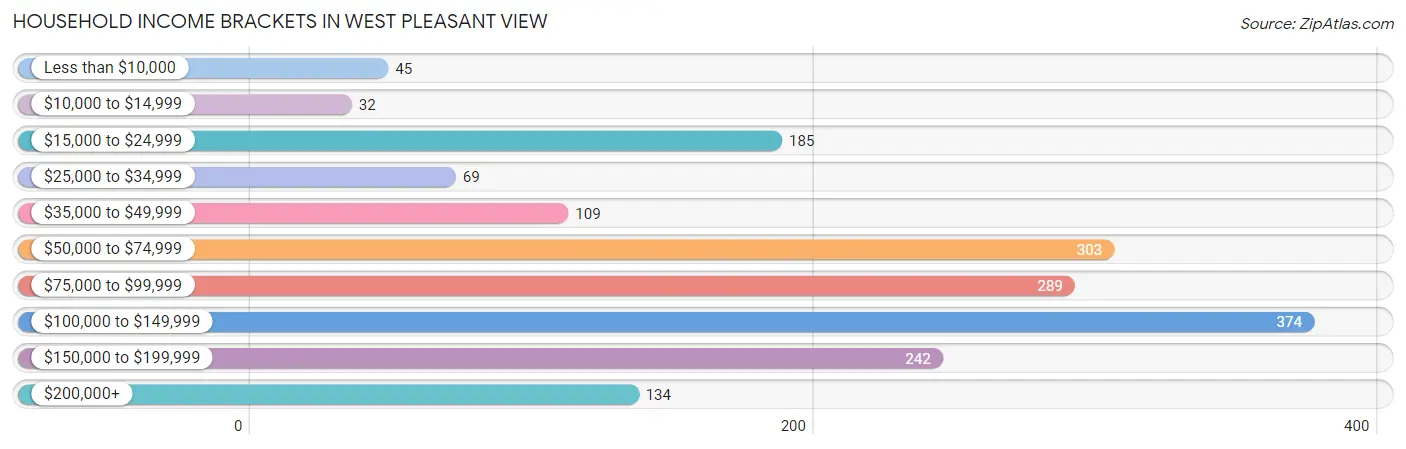
| Income Bracket | # Households | % Households |
| Less than $10,000 | 45 | 2.5% |
| $10,000 to $14,999 | 32 | 1.8% |
| $15,000 to $24,999 | 185 | 10.4% |
| $25,000 to $34,999 | 69 | 3.9% |
| $35,000 to $49,999 | 109 | 6.1% |
| $50,000 to $74,999 | 303 | 17.0% |
| $75,000 to $99,999 | 289 | 16.2% |
| $100,000 to $149,999 | 374 | 21.0% |
| $150,000 to $199,999 | 242 | 13.6% |
| $200,000+ | 134 | 7.5% |
Household Income by Householder Age in West Pleasant View
The median household income in West Pleasant View is $84,839, with the highest median household income of $106,346 found in the 45 to 64 years age bracket for the primary householder. A total of 666 households (37.4%) fall into this category. Meanwhile, the 15 to 24 years age bracket for the primary householder has the lowest median household income of $0, with 164 households (9.2%) in this group.
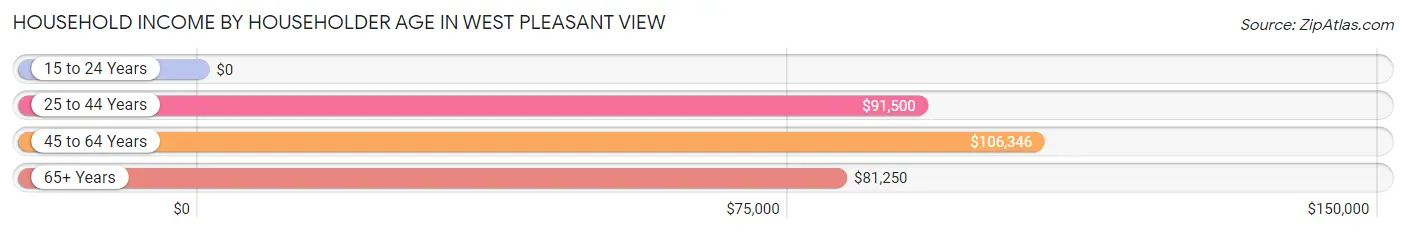
| Income Bracket | # Households | Median Income |
| 15 to 24 Years | 164 (9.2%) | $0 |
| 25 to 44 Years | 744 (41.7%) | $91,500 |
| 45 to 64 Years | 666 (37.4%) | $106,346 |
| 65+ Years | 208 (11.7%) | $81,250 |
| Total | 1,782 (100.0%) | $84,839 |
Poverty in West Pleasant View
Income Below Poverty by Sex and Age in West Pleasant View
With 11.2% poverty level for males and 30.4% for females among the residents of West Pleasant View, 12 to 14 year old males and 18 to 24 year old females are the most vulnerable to poverty, with 16 males (100.0%) and 406 females (76.6%) in their respective age groups living below the poverty level.
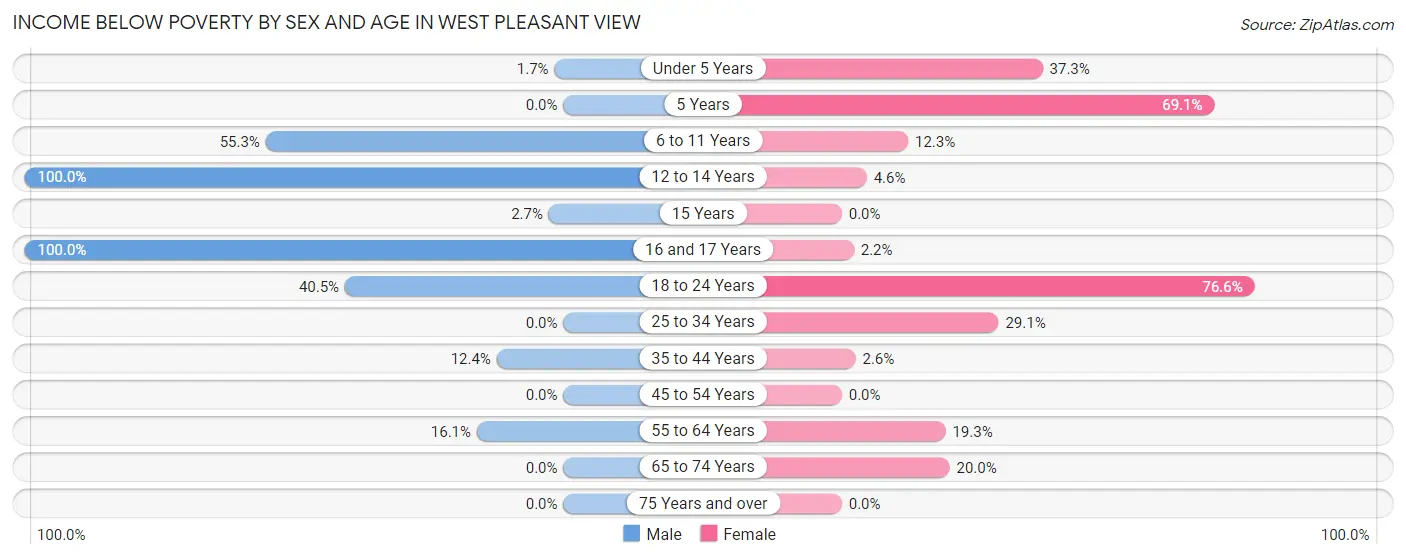
| Age Bracket | Male | Female |
| Under 5 Years | 3 (1.7%) | 60 (37.3%) |
| 5 Years | 0 (0.0%) | 56 (69.1%) |
| 6 to 11 Years | 100 (55.2%) | 15 (12.3%) |
| 12 to 14 Years | 16 (100.0%) | 3 (4.6%) |
| 15 Years | 2 (2.7%) | 0 (0.0%) |
| 16 and 17 Years | 3 (100.0%) | 3 (2.2%) |
| 18 to 24 Years | 45 (40.5%) | 406 (76.6%) |
| 25 to 34 Years | 0 (0.0%) | 123 (29.1%) |
| 35 to 44 Years | 36 (12.4%) | 6 (2.5%) |
| 45 to 54 Years | 0 (0.0%) | 0 (0.0%) |
| 55 to 64 Years | 52 (16.1%) | 72 (19.3%) |
| 65 to 74 Years | 0 (0.0%) | 20 (20.0%) |
| 75 Years and over | 0 (0.0%) | 0 (0.0%) |
| Total | 257 (11.2%) | 764 (30.4%) |
Income Above Poverty by Sex and Age in West Pleasant View
According to the poverty statistics in West Pleasant View, males aged 5 years and females aged 15 years are the age groups that are most secure financially, with 100.0% of males and 100.0% of females in these age groups living above the poverty line.
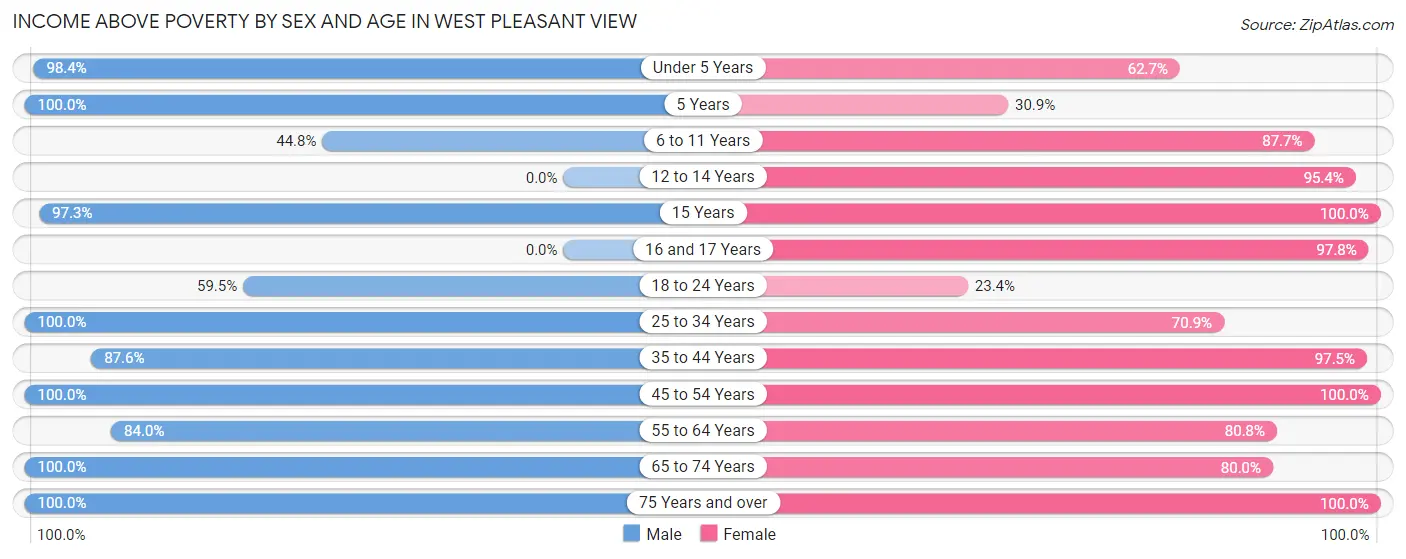
| Age Bracket | Male | Female |
| Under 5 Years | 179 (98.4%) | 101 (62.7%) |
| 5 Years | 22 (100.0%) | 25 (30.9%) |
| 6 to 11 Years | 81 (44.8%) | 107 (87.7%) |
| 12 to 14 Years | 0 (0.0%) | 62 (95.4%) |
| 15 Years | 72 (97.3%) | 25 (100.0%) |
| 16 and 17 Years | 0 (0.0%) | 132 (97.8%) |
| 18 to 24 Years | 66 (59.5%) | 124 (23.4%) |
| 25 to 34 Years | 653 (100.0%) | 300 (70.9%) |
| 35 to 44 Years | 255 (87.6%) | 229 (97.5%) |
| 45 to 54 Years | 217 (100.0%) | 182 (100.0%) |
| 55 to 64 Years | 272 (84.0%) | 302 (80.7%) |
| 65 to 74 Years | 153 (100.0%) | 80 (80.0%) |
| 75 Years and over | 66 (100.0%) | 83 (100.0%) |
| Total | 2,036 (88.8%) | 1,752 (69.6%) |
Income Below Poverty Among Married-Couple Families in West Pleasant View
The poverty statistics for married-couple families in West Pleasant View show that 5.8% or 38 of the total 652 families live below the poverty line. Families with no children have the highest poverty rate of 10.4%, comprising of 38 families. On the other hand, families with 1 or 2 children have the lowest poverty rate of 0.0%, which includes 0 families.
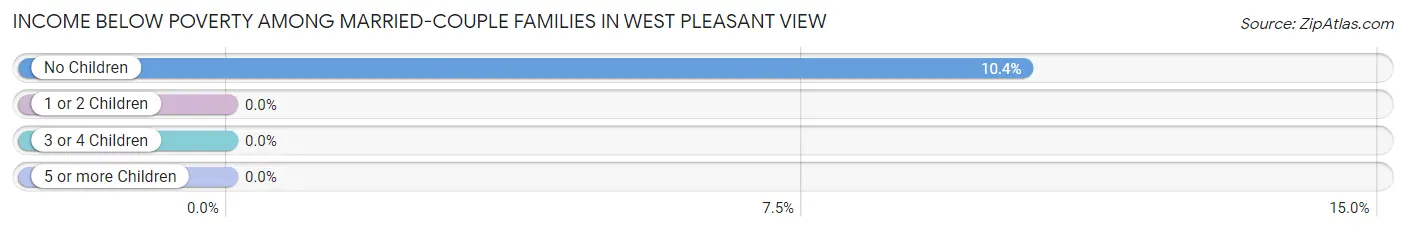
| Children | Above Poverty | Below Poverty |
| No Children | 328 (89.6%) | 38 (10.4%) |
| 1 or 2 Children | 177 (100.0%) | 0 (0.0%) |
| 3 or 4 Children | 109 (100.0%) | 0 (0.0%) |
| 5 or more Children | 0 (0.0%) | 0 (0.0%) |
| Total | 614 (94.2%) | 38 (5.8%) |
Income Below Poverty Among Single-Parent Households in West Pleasant View
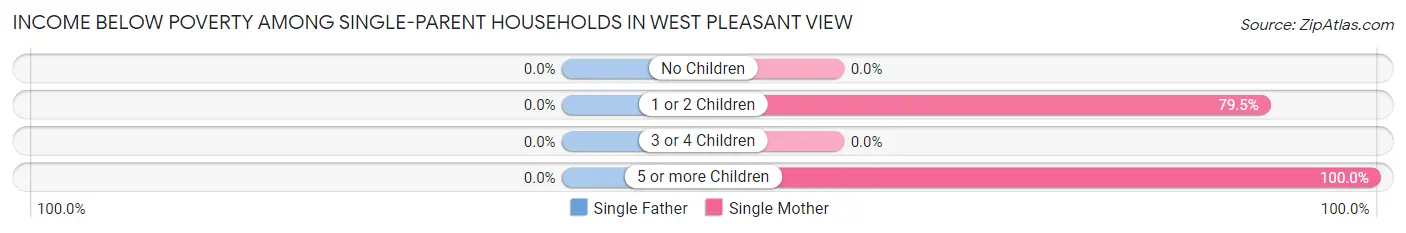
| Children | Single Father | Single Mother |
| No Children | 0 (0.0%) | 0 (0.0%) |
| 1 or 2 Children | 0 (0.0%) | 128 (79.5%) |
| 3 or 4 Children | 0 (0.0%) | 0 (0.0%) |
| 5 or more Children | 0 (0.0%) | 2 (100.0%) |
| Total | 0 (0.0%) | 130 (66.3%) |
Income Below Poverty Among Married-Couple vs Single-Parent Households in West Pleasant View
The poverty data for West Pleasant View shows that 38 of the married-couple family households (5.8%) and 130 of the single-parent households (27.6%) are living below the poverty level. Within the married-couple family households, those with no children have the highest poverty rate, with 38 households (10.4%) falling below the poverty line. Among the single-parent households, those with 5 or more children have the highest poverty rate, with 2 household (100.0%) living below poverty.
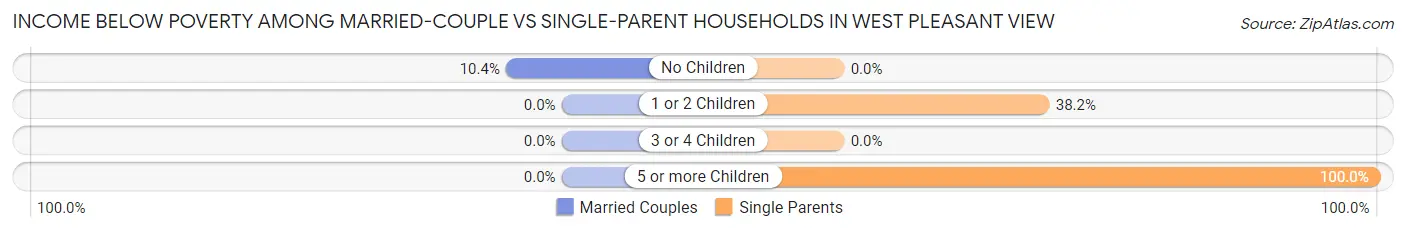
| Children | Married-Couple Families | Single-Parent Households |
| No Children | 38 (10.4%) | 0 (0.0%) |
| 1 or 2 Children | 0 (0.0%) | 128 (38.2%) |
| 3 or 4 Children | 0 (0.0%) | 0 (0.0%) |
| 5 or more Children | 0 (0.0%) | 2 (100.0%) |
| Total | 38 (5.8%) | 130 (27.6%) |
Employment Characteristics in West Pleasant View
Employment by Class of Employer in West Pleasant View
Among the 2,627 employed individuals in West Pleasant View, private company employees (1,826 | 69.5%), not-for-profit organizations (227 | 8.6%), and self-employed (incorporated) (209 | 8.0%) make up the most common classes of employment.
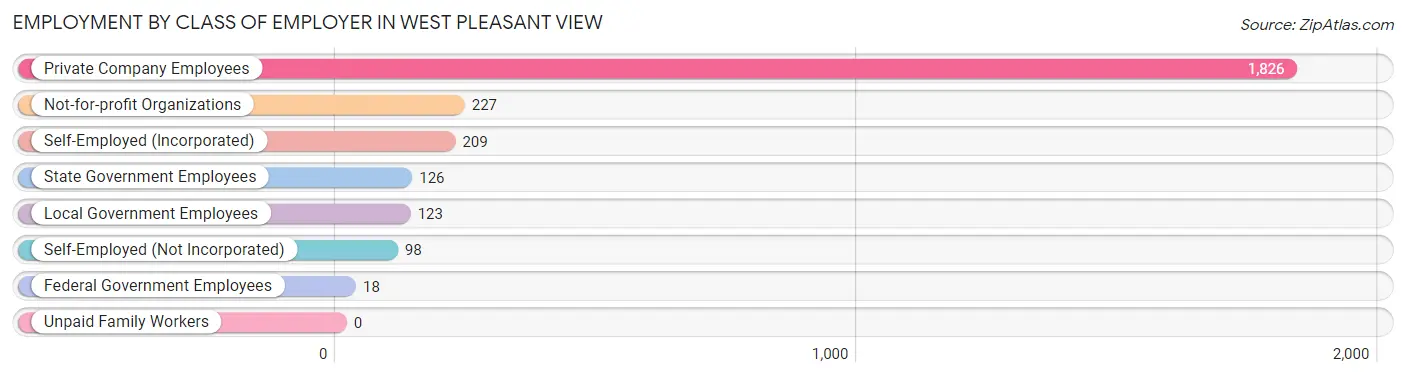
| Employer Class | # Employees | % Employees |
| Private Company Employees | 1,826 | 69.5% |
| Self-Employed (Incorporated) | 209 | 8.0% |
| Self-Employed (Not Incorporated) | 98 | 3.7% |
| Not-for-profit Organizations | 227 | 8.6% |
| Local Government Employees | 123 | 4.7% |
| State Government Employees | 126 | 4.8% |
| Federal Government Employees | 18 | 0.7% |
| Unpaid Family Workers | 0 | 0.0% |
| Total | 2,627 | 100.0% |
Employment Status by Age in West Pleasant View
According to the labor force statistics for West Pleasant View, out of the total population over 16 years of age (4,268), 65.6% or 2,800 individuals are in the labor force, with 5.4% or 151 of them unemployed. The age group with the highest labor force participation rate is 25 to 29 years, with 95.0% or 510 individuals in the labor force. Within the labor force, the 16 to 19 years age range has the highest percentage of unemployed individuals, with 35.4% or 23 of them being unemployed.
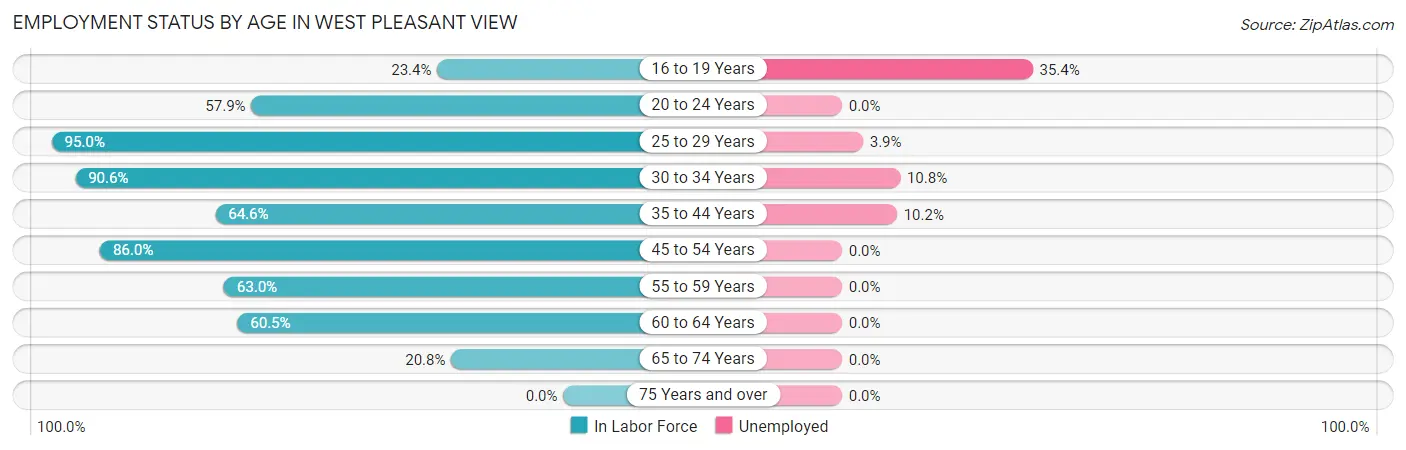
| Age Bracket | In Labor Force | Unemployed |
| 16 to 19 Years | 65 (23.4%) | 23 (35.4%) |
| 20 to 24 Years | 314 (57.9%) | 0 (0.0%) |
| 25 to 29 Years | 510 (95.0%) | 20 (3.9%) |
| 30 to 34 Years | 566 (90.6%) | 61 (10.8%) |
| 35 to 44 Years | 459 (64.6%) | 47 (10.2%) |
| 45 to 54 Years | 382 (86.0%) | 0 (0.0%) |
| 55 to 59 Years | 259 (63.0%) | 0 (0.0%) |
| 60 to 64 Years | 190 (60.5%) | 0 (0.0%) |
| 65 to 74 Years | 53 (20.8%) | 0 (0.0%) |
| 75 Years and over | 0 (0.0%) | 0 (0.0%) |
| Total | 2,800 (65.6%) | 151 (5.4%) |
Employment Status by Educational Attainment in West Pleasant View
According to labor force statistics for West Pleasant View, 77.8% of individuals (2,366) out of the total population between 25 and 64 years of age (3,041) are in the labor force, with 5.4% or 128 of them being unemployed. The group with the highest labor force participation rate are those with the educational attainment of bachelor's degree or higher, with 93.7% or 1,212 individuals in the labor force. Within the labor force, individuals with high school diploma education have the highest percentage of unemployment, with 11.6% or 47 of them being unemployed.
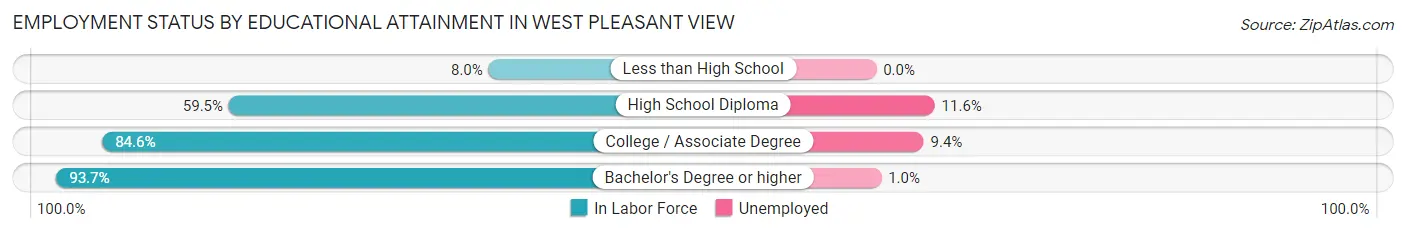
| Educational Attainment | In Labor Force | Unemployed |
| Less than High School | 16 (8.0%) | 0 (0.0%) |
| High School Diploma | 405 (59.5%) | 79 (11.6%) |
| College / Associate Degree | 734 (84.6%) | 82 (9.4%) |
| Bachelor's Degree or higher | 1,212 (93.7%) | 13 (1.0%) |
| Total | 2,366 (77.8%) | 164 (5.4%) |
Employment Occupations by Sex in West Pleasant View
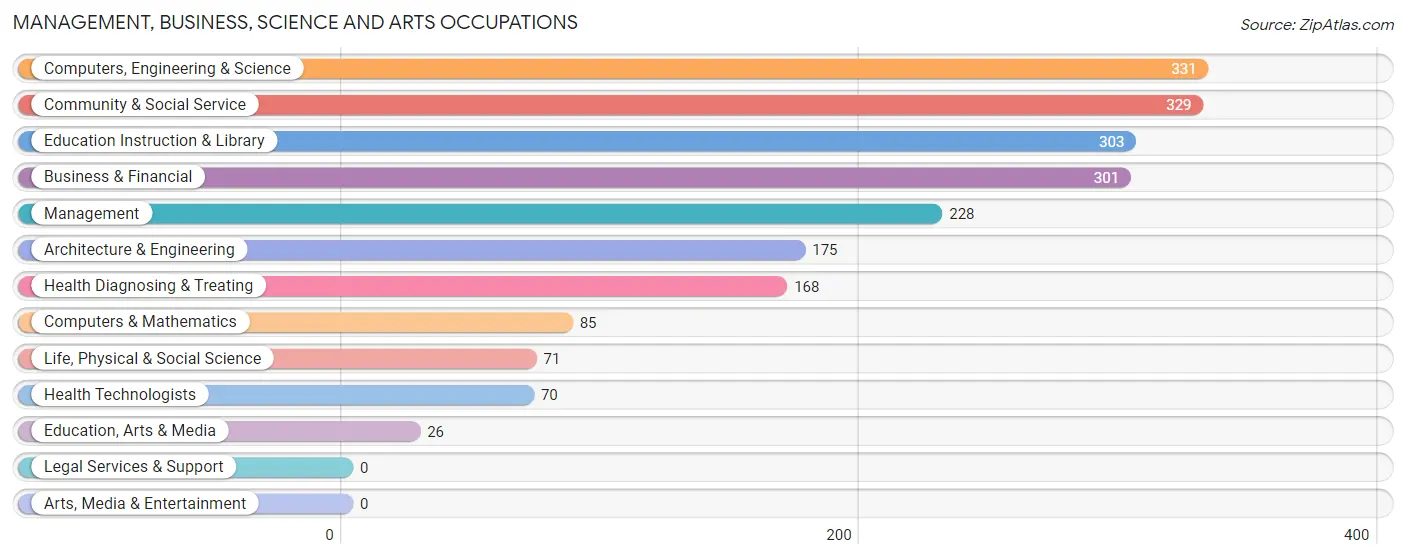
Management, Business, Science and Arts Occupations
The most common Management, Business, Science and Arts occupations in West Pleasant View are Computers, Engineering & Science (331 | 12.5%), Community & Social Service (329 | 12.4%), Education Instruction & Library (303 | 11.5%), Business & Financial (301 | 11.4%), and Management (228 | 8.6%).
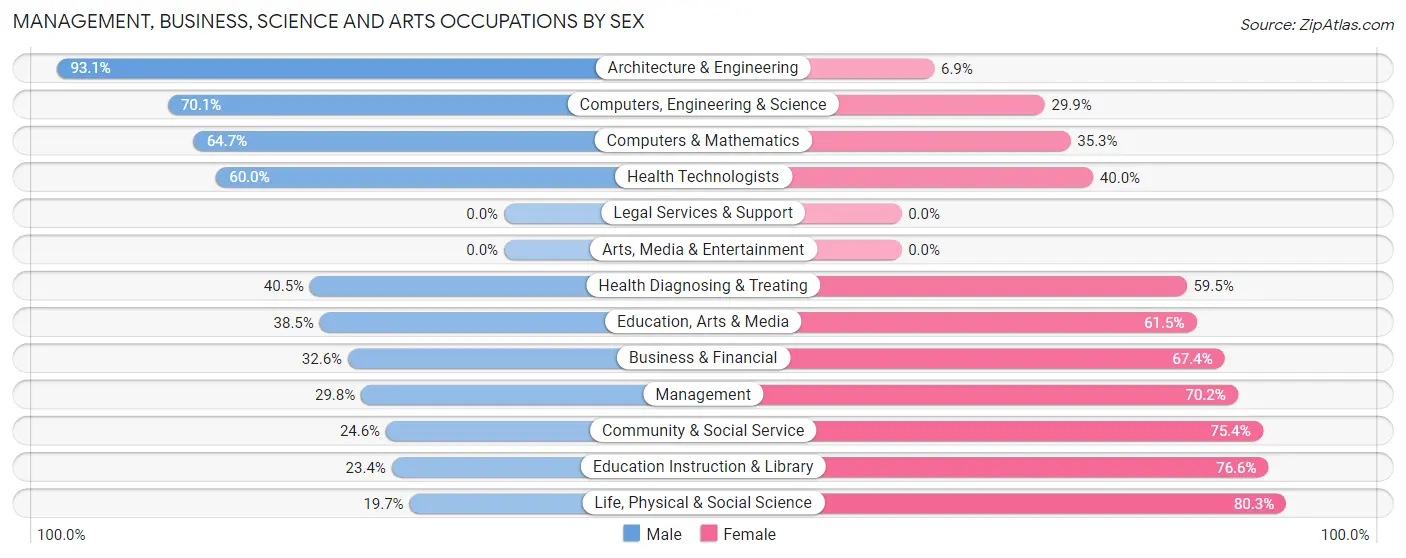
Management, Business, Science and Arts Occupations by Sex
Within the Management, Business, Science and Arts occupations in West Pleasant View, the most male-oriented occupations are Architecture & Engineering (93.1%), Computers, Engineering & Science (70.1%), and Computers & Mathematics (64.7%), while the most female-oriented occupations are Life, Physical & Social Science (80.3%), Education Instruction & Library (76.6%), and Community & Social Service (75.4%).
| Occupation | Male | Female |
| Management | 68 (29.8%) | 160 (70.2%) |
| Business & Financial | 98 (32.6%) | 203 (67.4%) |
| Computers, Engineering & Science | 232 (70.1%) | 99 (29.9%) |
| Computers & Mathematics | 55 (64.7%) | 30 (35.3%) |
| Architecture & Engineering | 163 (93.1%) | 12 (6.9%) |
| Life, Physical & Social Science | 14 (19.7%) | 57 (80.3%) |
| Community & Social Service | 81 (24.6%) | 248 (75.4%) |
| Education, Arts & Media | 10 (38.5%) | 16 (61.5%) |
| Legal Services & Support | 0 (0.0%) | 0 (0.0%) |
| Education Instruction & Library | 71 (23.4%) | 232 (76.6%) |
| Arts, Media & Entertainment | 0 (0.0%) | 0 (0.0%) |
| Health Diagnosing & Treating | 68 (40.5%) | 100 (59.5%) |
| Health Technologists | 42 (60.0%) | 28 (40.0%) |
| Total (Category) | 547 (40.3%) | 810 (59.7%) |
| Total (Overall) | 1,273 (48.1%) | 1,374 (51.9%) |
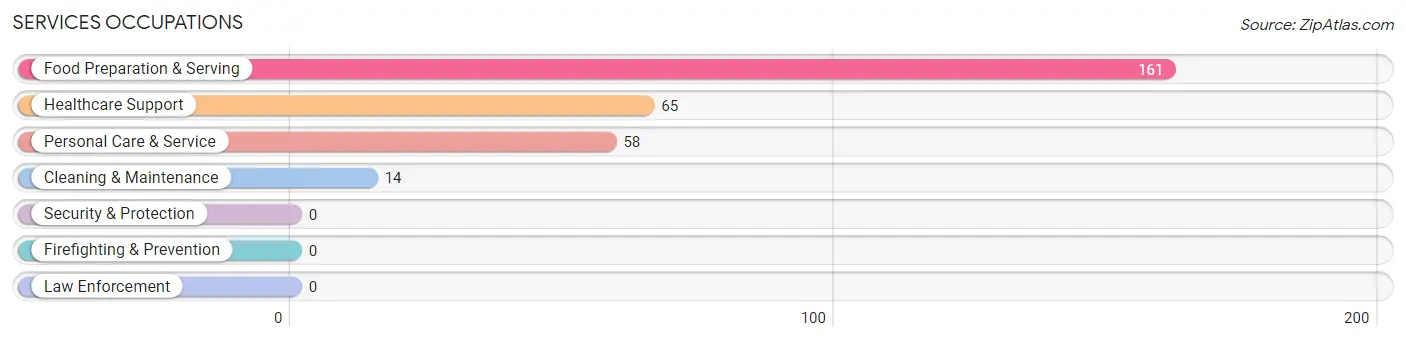
Services Occupations
The most common Services occupations in West Pleasant View are Food Preparation & Serving (161 | 6.1%), Healthcare Support (65 | 2.5%), Personal Care & Service (58 | 2.2%), and Cleaning & Maintenance (14 | 0.5%).
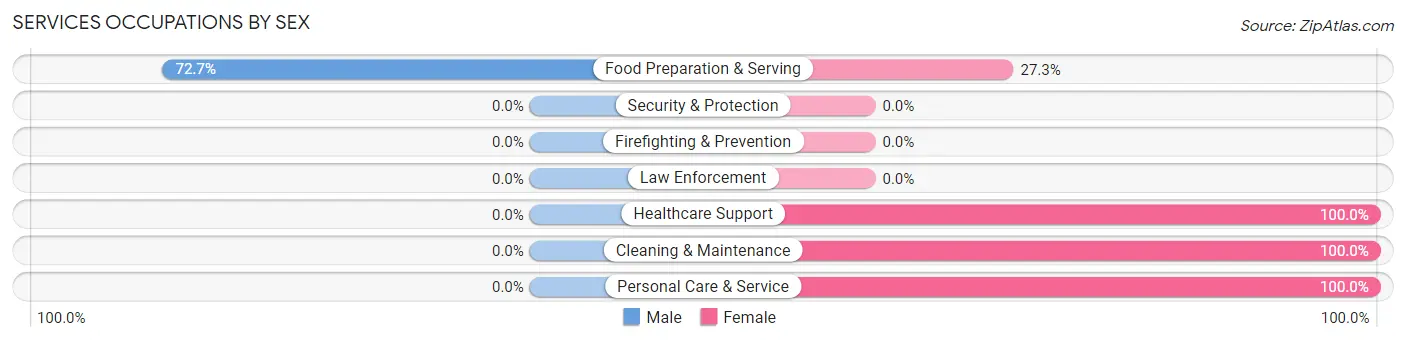
Services Occupations by Sex
| Occupation | Male | Female |
| Healthcare Support | 0 (0.0%) | 65 (100.0%) |
| Security & Protection | 0 (0.0%) | 0 (0.0%) |
| Firefighting & Prevention | 0 (0.0%) | 0 (0.0%) |
| Law Enforcement | 0 (0.0%) | 0 (0.0%) |
| Food Preparation & Serving | 117 (72.7%) | 44 (27.3%) |
| Cleaning & Maintenance | 0 (0.0%) | 14 (100.0%) |
| Personal Care & Service | 0 (0.0%) | 58 (100.0%) |
| Total (Category) | 117 (39.3%) | 181 (60.7%) |
| Total (Overall) | 1,273 (48.1%) | 1,374 (51.9%) |
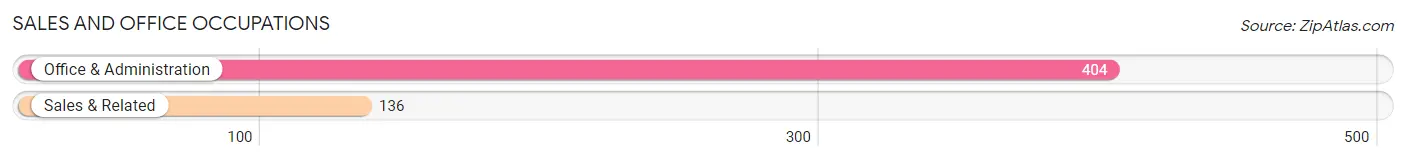
Sales and Office Occupations
The most common Sales and Office occupations in West Pleasant View are Office & Administration (404 | 15.3%), and Sales & Related (136 | 5.1%).
Sales and Office Occupations by Sex

| Occupation | Male | Female |
| Sales & Related | 136 (100.0%) | 0 (0.0%) |
| Office & Administration | 206 (51.0%) | 198 (49.0%) |
| Total (Category) | 342 (63.3%) | 198 (36.7%) |
| Total (Overall) | 1,273 (48.1%) | 1,374 (51.9%) |
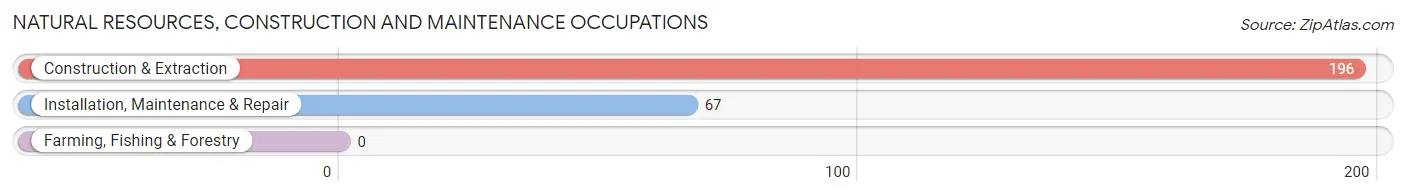
Natural Resources, Construction and Maintenance Occupations
The most common Natural Resources, Construction and Maintenance occupations in West Pleasant View are Construction & Extraction (196 | 7.4%), and Installation, Maintenance & Repair (67 | 2.5%).
Natural Resources, Construction and Maintenance Occupations by Sex
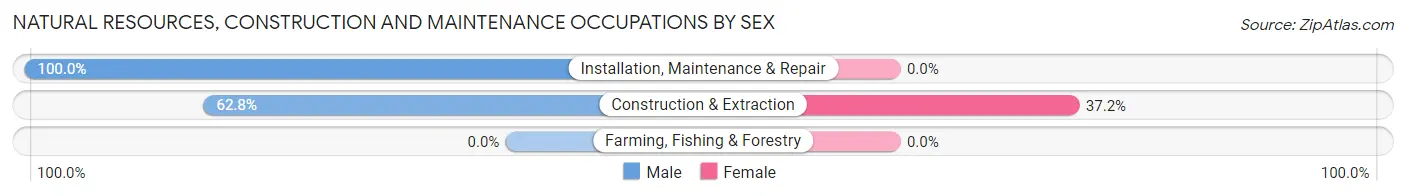
| Occupation | Male | Female |
| Farming, Fishing & Forestry | 0 (0.0%) | 0 (0.0%) |
| Construction & Extraction | 123 (62.8%) | 73 (37.2%) |
| Installation, Maintenance & Repair | 67 (100.0%) | 0 (0.0%) |
| Total (Category) | 190 (72.2%) | 73 (27.8%) |
| Total (Overall) | 1,273 (48.1%) | 1,374 (51.9%) |
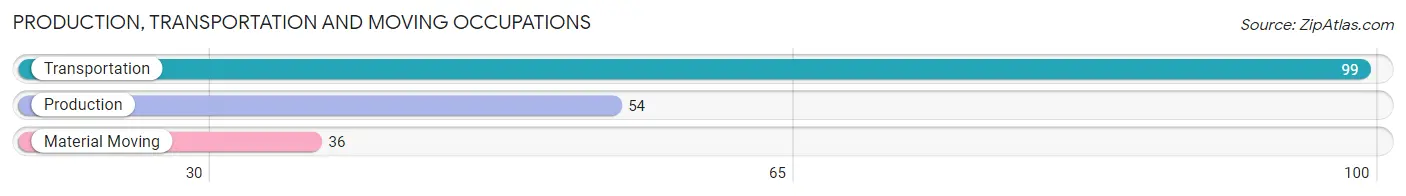
Production, Transportation and Moving Occupations
The most common Production, Transportation and Moving occupations in West Pleasant View are Transportation (99 | 3.7%), Production (54 | 2.0%), and Material Moving (36 | 1.4%).
Production, Transportation and Moving Occupations by Sex
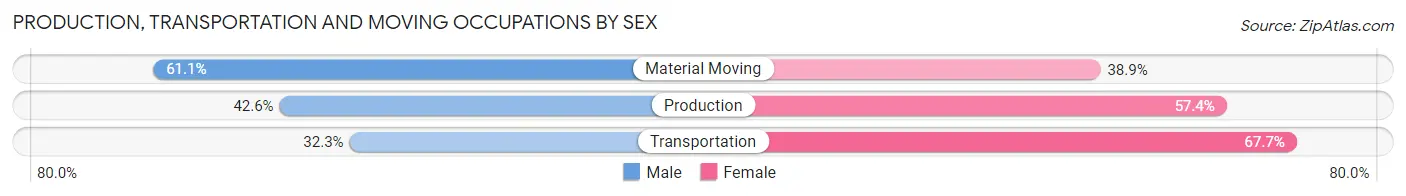
| Occupation | Male | Female |
| Production | 23 (42.6%) | 31 (57.4%) |
| Transportation | 32 (32.3%) | 67 (67.7%) |
| Material Moving | 22 (61.1%) | 14 (38.9%) |
| Total (Category) | 77 (40.7%) | 112 (59.3%) |
| Total (Overall) | 1,273 (48.1%) | 1,374 (51.9%) |
Employment Industries by Sex in West Pleasant View
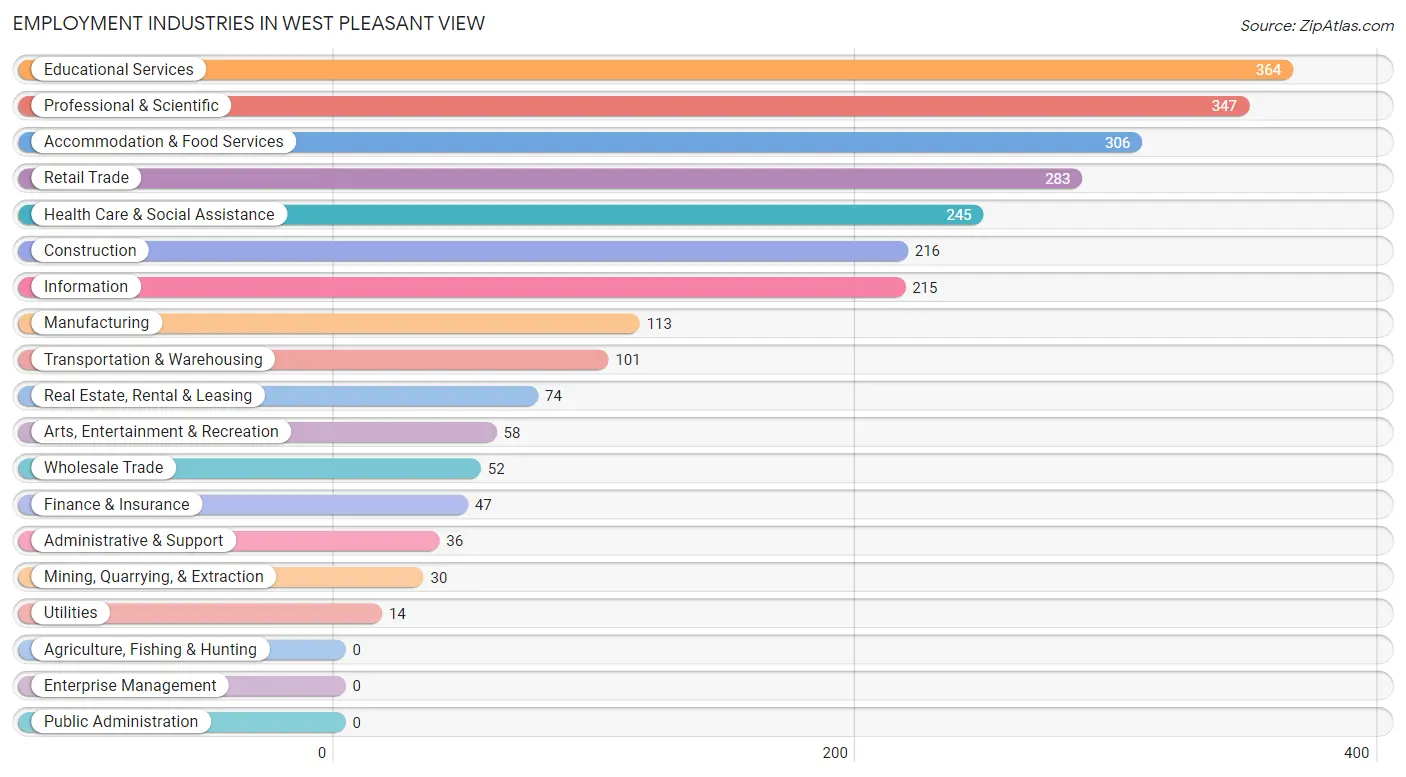
Employment Industries in West Pleasant View
The major employment industries in West Pleasant View include Educational Services (364 | 13.8%), Professional & Scientific (347 | 13.1%), Accommodation & Food Services (306 | 11.6%), Retail Trade (283 | 10.7%), and Health Care & Social Assistance (245 | 9.3%).
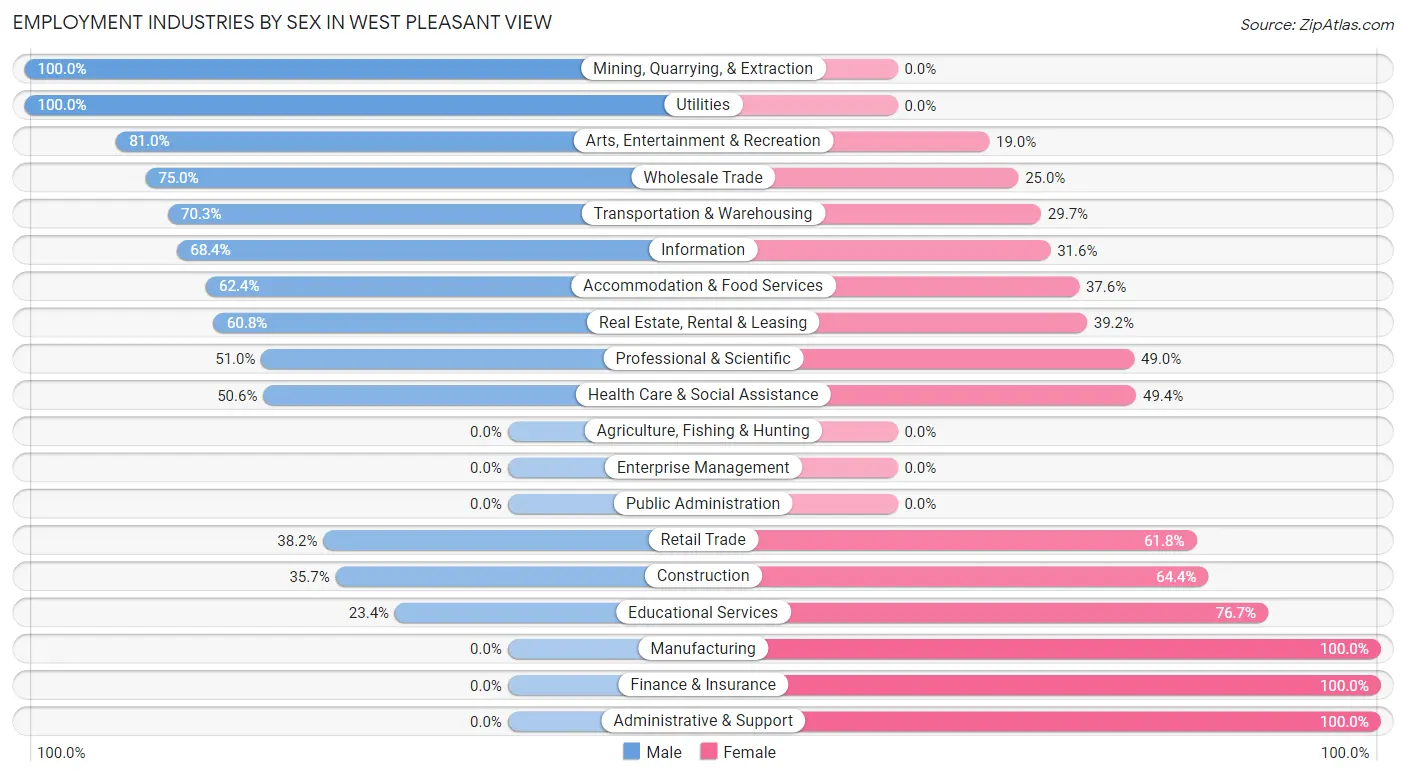
Employment Industries by Sex in West Pleasant View
The West Pleasant View industries that see more men than women are Mining, Quarrying, & Extraction (100.0%), Utilities (100.0%), and Arts, Entertainment & Recreation (81.0%), whereas the industries that tend to have a higher number of women are Manufacturing (100.0%), Finance & Insurance (100.0%), and Administrative & Support (100.0%).
| Industry | Male | Female |
| Agriculture, Fishing & Hunting | 0 (0.0%) | 0 (0.0%) |
| Mining, Quarrying, & Extraction | 30 (100.0%) | 0 (0.0%) |
| Construction | 77 (35.6%) | 139 (64.3%) |
| Manufacturing | 0 (0.0%) | 113 (100.0%) |
| Wholesale Trade | 39 (75.0%) | 13 (25.0%) |
| Retail Trade | 108 (38.2%) | 175 (61.8%) |
| Transportation & Warehousing | 71 (70.3%) | 30 (29.7%) |
| Utilities | 14 (100.0%) | 0 (0.0%) |
| Information | 147 (68.4%) | 68 (31.6%) |
| Finance & Insurance | 0 (0.0%) | 47 (100.0%) |
| Real Estate, Rental & Leasing | 45 (60.8%) | 29 (39.2%) |
| Professional & Scientific | 177 (51.0%) | 170 (49.0%) |
| Enterprise Management | 0 (0.0%) | 0 (0.0%) |
| Administrative & Support | 0 (0.0%) | 36 (100.0%) |
| Educational Services | 85 (23.4%) | 279 (76.6%) |
| Health Care & Social Assistance | 124 (50.6%) | 121 (49.4%) |
| Arts, Entertainment & Recreation | 47 (81.0%) | 11 (19.0%) |
| Accommodation & Food Services | 191 (62.4%) | 115 (37.6%) |
| Public Administration | 0 (0.0%) | 0 (0.0%) |
| Total | 1,273 (48.1%) | 1,374 (51.9%) |
Education in West Pleasant View
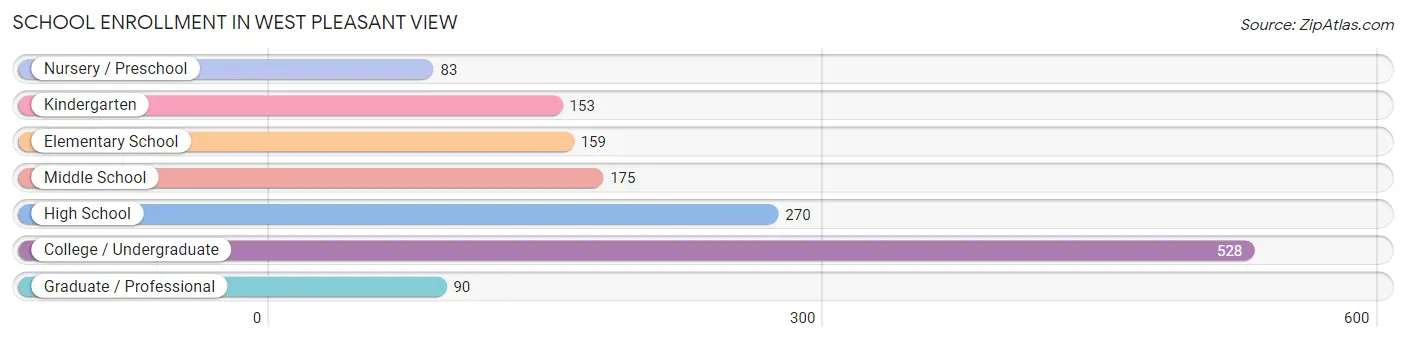
School Enrollment in West Pleasant View
The most common levels of schooling among the 1,458 students in West Pleasant View are college / undergraduate (528 | 36.2%), high school (270 | 18.5%), and middle school (175 | 12.0%).
| School Level | # Students | % Students |
| Nursery / Preschool | 83 | 5.7% |
| Kindergarten | 153 | 10.5% |
| Elementary School | 159 | 10.9% |
| Middle School | 175 | 12.0% |
| High School | 270 | 18.5% |
| College / Undergraduate | 528 | 36.2% |
| Graduate / Professional | 90 | 6.2% |
| Total | 1,458 | 100.0% |
School Enrollment by Age by Funding Source in West Pleasant View
Out of a total of 1,458 students who are enrolled in schools in West Pleasant View, 143 (9.8%) attend a private institution, while the remaining 1,315 (90.2%) are enrolled in public schools. The age group of 3 to 4 year olds has the highest likelihood of being enrolled in private schools, with 83 (100.0% in the age bracket) enrolled. Conversely, the age group of 10 to 14 year olds has the lowest likelihood of being enrolled in a private school, with 249 (100.0% in the age bracket) attending a public institution.
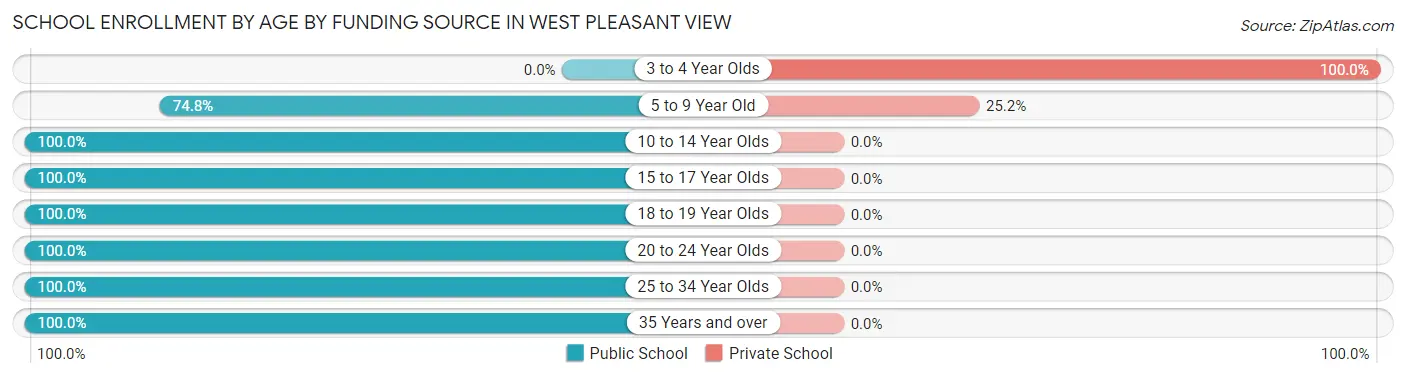
| Age Bracket | Public School | Private School |
| 3 to 4 Year Olds | 0 (0.0%) | 83 (100.0%) |
| 5 to 9 Year Old | 178 (74.8%) | 60 (25.2%) |
| 10 to 14 Year Olds | 249 (100.0%) | 0 (0.0%) |
| 15 to 17 Year Olds | 237 (100.0%) | 0 (0.0%) |
| 18 to 19 Year Olds | 107 (100.0%) | 0 (0.0%) |
| 20 to 24 Year Olds | 458 (100.0%) | 0 (0.0%) |
| 25 to 34 Year Olds | 60 (100.0%) | 0 (0.0%) |
| 35 Years and over | 26 (100.0%) | 0 (0.0%) |
| Total | 1,315 (90.2%) | 143 (9.8%) |
Educational Attainment by Field of Study in West Pleasant View
Engineering (259 | 17.4%), arts & humanities (246 | 16.6%), business (212 | 14.3%), liberal arts & history (194 | 13.1%), and bio, nature & agricultural (129 | 8.7%) are the most common fields of study among 1,486 individuals in West Pleasant View who have obtained a bachelor's degree or higher.
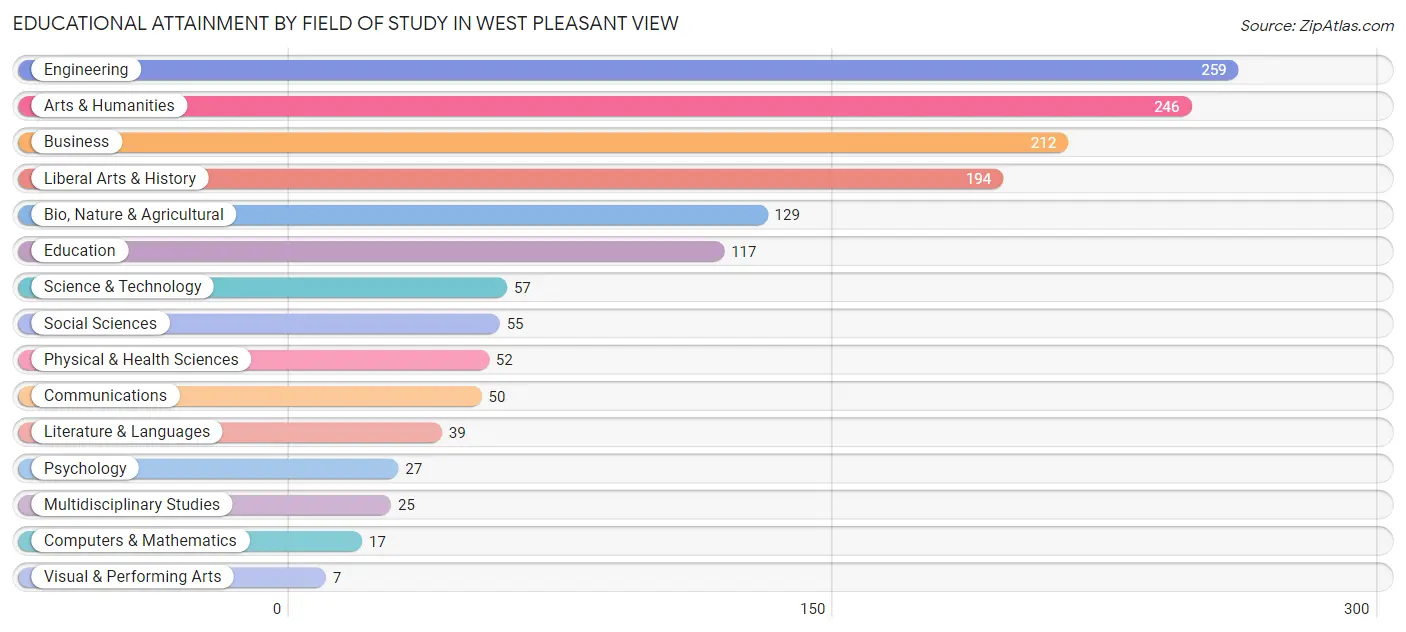
| Field of Study | # Graduates | % Graduates |
| Computers & Mathematics | 17 | 1.1% |
| Bio, Nature & Agricultural | 129 | 8.7% |
| Physical & Health Sciences | 52 | 3.5% |
| Psychology | 27 | 1.8% |
| Social Sciences | 55 | 3.7% |
| Engineering | 259 | 17.4% |
| Multidisciplinary Studies | 25 | 1.7% |
| Science & Technology | 57 | 3.8% |
| Business | 212 | 14.3% |
| Education | 117 | 7.9% |
| Literature & Languages | 39 | 2.6% |
| Liberal Arts & History | 194 | 13.1% |
| Visual & Performing Arts | 7 | 0.5% |
| Communications | 50 | 3.4% |
| Arts & Humanities | 246 | 16.6% |
| Total | 1,486 | 100.0% |
Transportation & Commute in West Pleasant View
Vehicle Availability by Sex in West Pleasant View
The most prevalent vehicle ownership categories in West Pleasant View are males with 2 vehicles (467, accounting for 37.2%) and females with 2 vehicles (346, making up 34.0%).
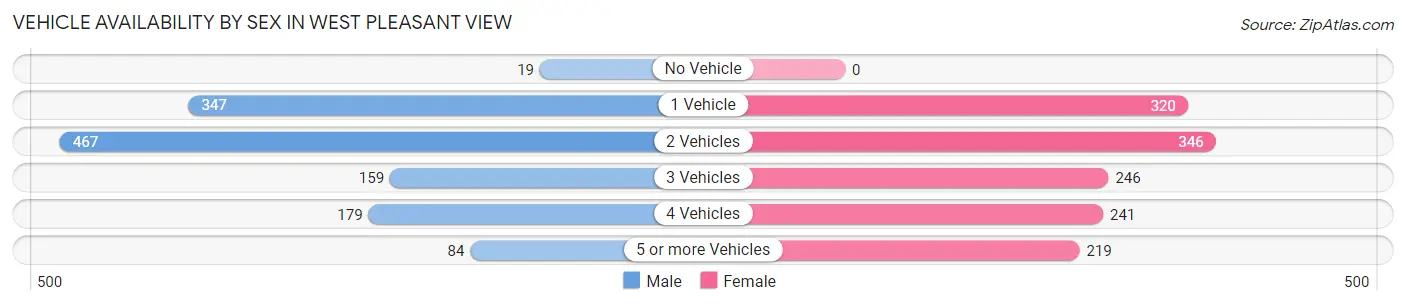
| Vehicles Available | Male | Female |
| No Vehicle | 19 (1.5%) | 0 (0.0%) |
| 1 Vehicle | 347 (27.7%) | 320 (23.3%) |
| 2 Vehicles | 467 (37.2%) | 346 (25.2%) |
| 3 Vehicles | 159 (12.7%) | 246 (17.9%) |
| 4 Vehicles | 179 (14.3%) | 241 (17.6%) |
| 5 or more Vehicles | 84 (6.7%) | 219 (16.0%) |
| Total | 1,255 (100.0%) | 1,372 (100.0%) |
Commute Time in West Pleasant View
The most frequently occuring commute durations in West Pleasant View are 10 to 14 minutes (472 commuters, 21.3%), 30 to 34 minutes (338 commuters, 15.2%), and 15 to 19 minutes (235 commuters, 10.6%).
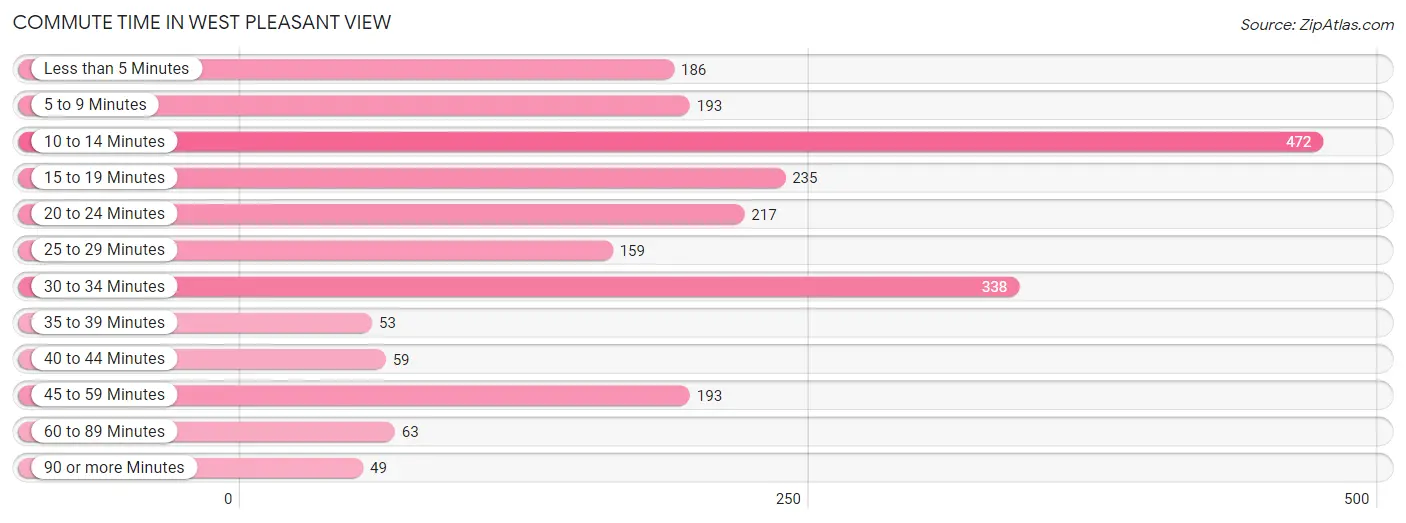
| Commute Time | # Commuters | % Commuters |
| Less than 5 Minutes | 186 | 8.4% |
| 5 to 9 Minutes | 193 | 8.7% |
| 10 to 14 Minutes | 472 | 21.3% |
| 15 to 19 Minutes | 235 | 10.6% |
| 20 to 24 Minutes | 217 | 9.8% |
| 25 to 29 Minutes | 159 | 7.2% |
| 30 to 34 Minutes | 338 | 15.2% |
| 35 to 39 Minutes | 53 | 2.4% |
| 40 to 44 Minutes | 59 | 2.7% |
| 45 to 59 Minutes | 193 | 8.7% |
| 60 to 89 Minutes | 63 | 2.8% |
| 90 or more Minutes | 49 | 2.2% |
Commute Time by Sex in West Pleasant View
The most common commute times in West Pleasant View are 10 to 14 minutes (246 commuters, 24.2%) for males and 10 to 14 minutes (226 commuters, 18.8%) for females.
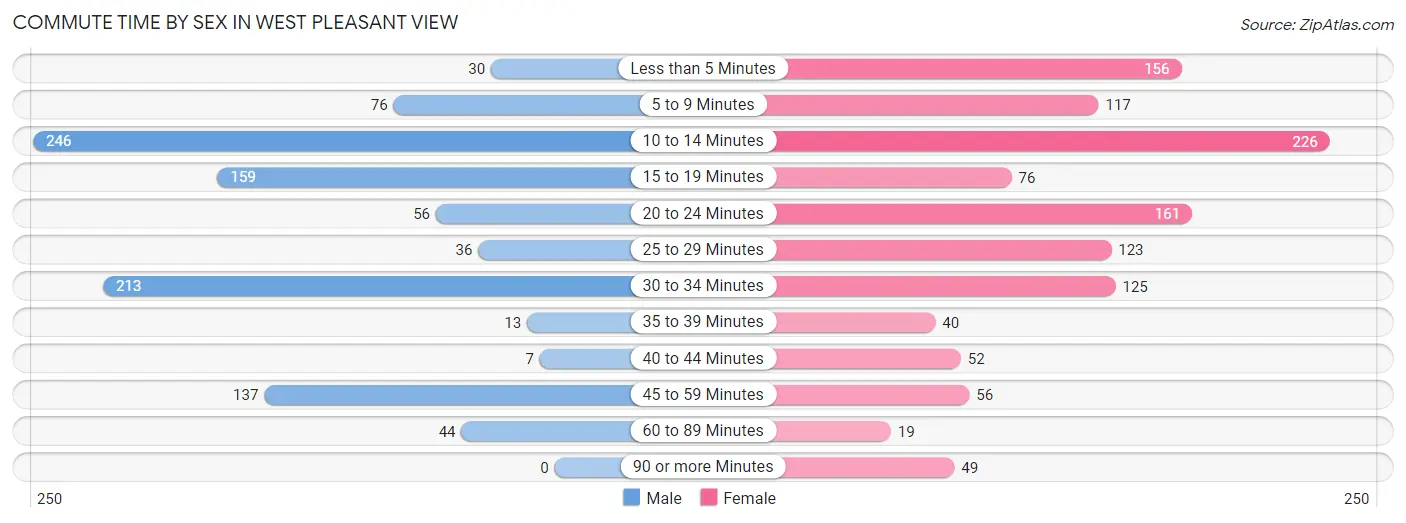
| Commute Time | Male | Female |
| Less than 5 Minutes | 30 (2.9%) | 156 (13.0%) |
| 5 to 9 Minutes | 76 (7.5%) | 117 (9.8%) |
| 10 to 14 Minutes | 246 (24.2%) | 226 (18.8%) |
| 15 to 19 Minutes | 159 (15.6%) | 76 (6.3%) |
| 20 to 24 Minutes | 56 (5.5%) | 161 (13.4%) |
| 25 to 29 Minutes | 36 (3.5%) | 123 (10.2%) |
| 30 to 34 Minutes | 213 (20.9%) | 125 (10.4%) |
| 35 to 39 Minutes | 13 (1.3%) | 40 (3.3%) |
| 40 to 44 Minutes | 7 (0.7%) | 52 (4.3%) |
| 45 to 59 Minutes | 137 (13.5%) | 56 (4.7%) |
| 60 to 89 Minutes | 44 (4.3%) | 19 (1.6%) |
| 90 or more Minutes | 0 (0.0%) | 49 (4.1%) |
Time of Departure to Work by Sex in West Pleasant View
The most frequent times of departure to work in West Pleasant View are 6:30 AM to 6:59 AM (212, 20.8%) for males and 7:30 AM to 7:59 AM (352, 29.3%) for females.
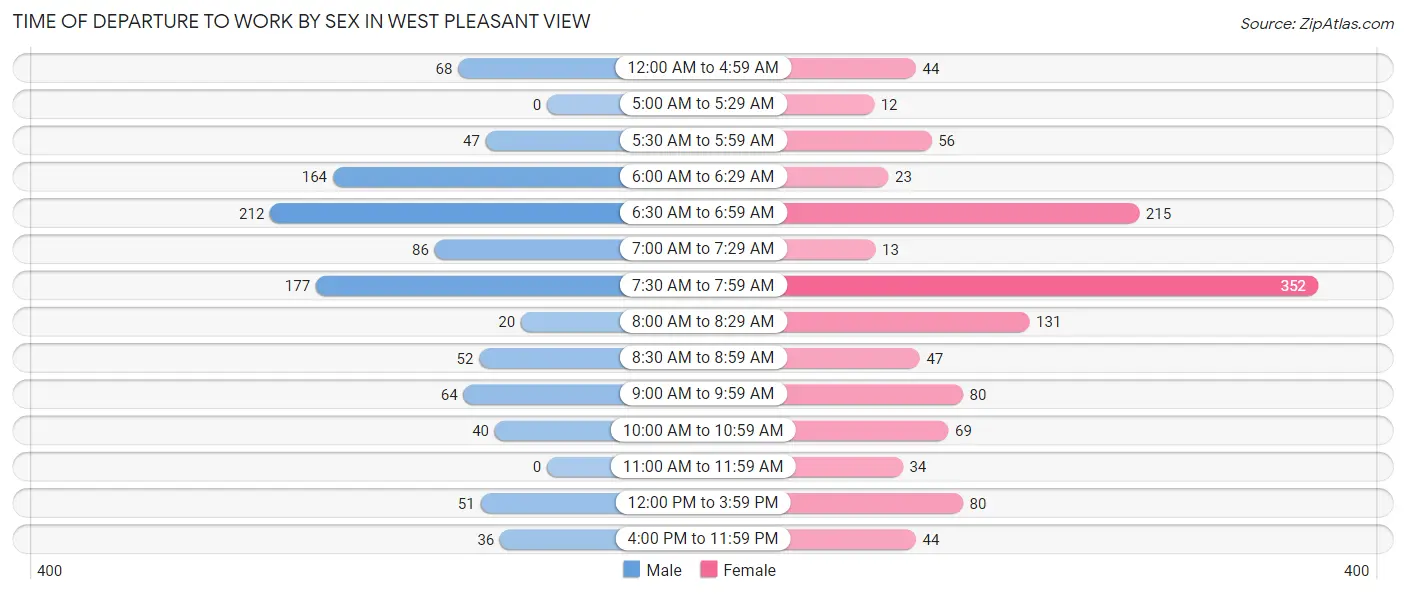
| Time of Departure | Male | Female |
| 12:00 AM to 4:59 AM | 68 (6.7%) | 44 (3.7%) |
| 5:00 AM to 5:29 AM | 0 (0.0%) | 12 (1.0%) |
| 5:30 AM to 5:59 AM | 47 (4.6%) | 56 (4.7%) |
| 6:00 AM to 6:29 AM | 164 (16.1%) | 23 (1.9%) |
| 6:30 AM to 6:59 AM | 212 (20.8%) | 215 (17.9%) |
| 7:00 AM to 7:29 AM | 86 (8.5%) | 13 (1.1%) |
| 7:30 AM to 7:59 AM | 177 (17.4%) | 352 (29.3%) |
| 8:00 AM to 8:29 AM | 20 (2.0%) | 131 (10.9%) |
| 8:30 AM to 8:59 AM | 52 (5.1%) | 47 (3.9%) |
| 9:00 AM to 9:59 AM | 64 (6.3%) | 80 (6.7%) |
| 10:00 AM to 10:59 AM | 40 (3.9%) | 69 (5.8%) |
| 11:00 AM to 11:59 AM | 0 (0.0%) | 34 (2.8%) |
| 12:00 PM to 3:59 PM | 51 (5.0%) | 80 (6.7%) |
| 4:00 PM to 11:59 PM | 36 (3.5%) | 44 (3.7%) |
| Total | 1,017 (100.0%) | 1,200 (100.0%) |
Housing Occupancy in West Pleasant View
Occupancy by Ownership in West Pleasant View
Of the total 1,782 dwellings in West Pleasant View, owner-occupied units account for 998 (56.0%), while renter-occupied units make up 784 (44.0%).
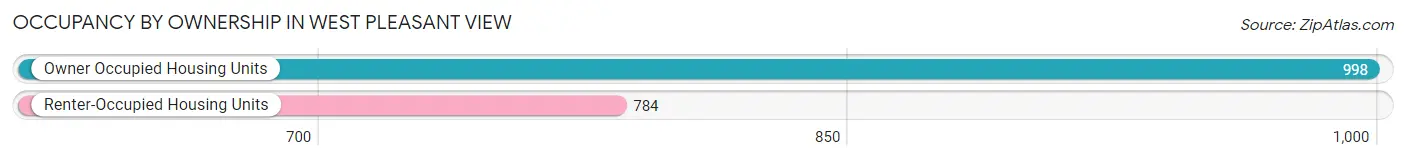
| Occupancy | # Housing Units | % Housing Units |
| Owner Occupied Housing Units | 998 | 56.0% |
| Renter-Occupied Housing Units | 784 | 44.0% |
| Total Occupied Housing Units | 1,782 | 100.0% |
Occupancy by Household Size in West Pleasant View
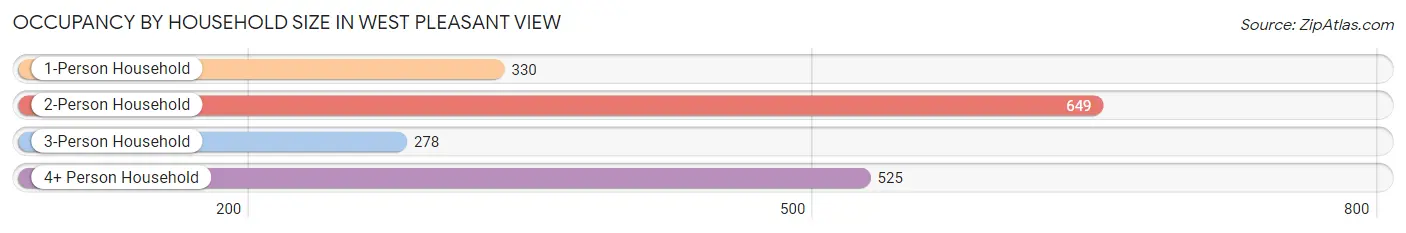
| Household Size | # Housing Units | % Housing Units |
| 1-Person Household | 330 | 18.5% |
| 2-Person Household | 649 | 36.4% |
| 3-Person Household | 278 | 15.6% |
| 4+ Person Household | 525 | 29.5% |
| Total Housing Units | 1,782 | 100.0% |
Occupancy by Ownership by Household Size in West Pleasant View
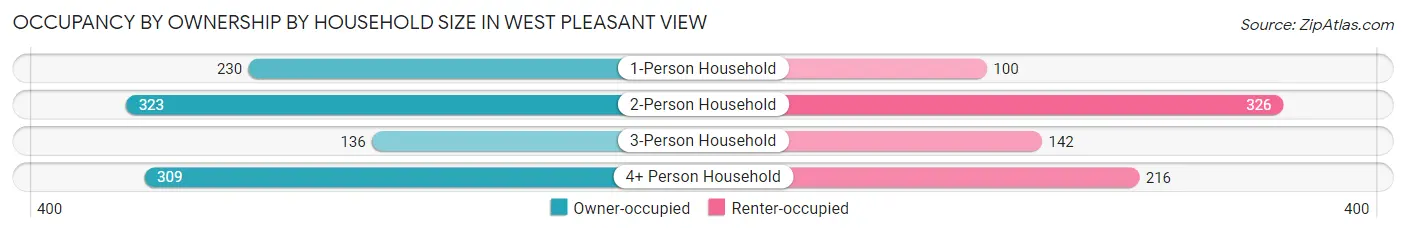
| Household Size | Owner-occupied | Renter-occupied |
| 1-Person Household | 230 (69.7%) | 100 (30.3%) |
| 2-Person Household | 323 (49.8%) | 326 (50.2%) |
| 3-Person Household | 136 (48.9%) | 142 (51.1%) |
| 4+ Person Household | 309 (58.9%) | 216 (41.1%) |
| Total Housing Units | 998 (56.0%) | 784 (44.0%) |
Occupancy by Educational Attainment in West Pleasant View
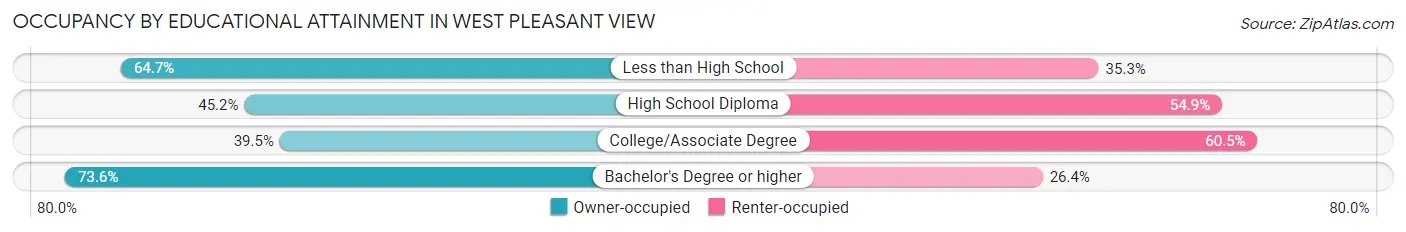
| Household Size | Owner-occupied | Renter-occupied |
| Less than High School | 66 (64.7%) | 36 (35.3%) |
| High School Diploma | 163 (45.2%) | 198 (54.8%) |
| College/Associate Degree | 234 (39.5%) | 358 (60.5%) |
| Bachelor's Degree or higher | 535 (73.6%) | 192 (26.4%) |
Occupancy by Age of Householder in West Pleasant View
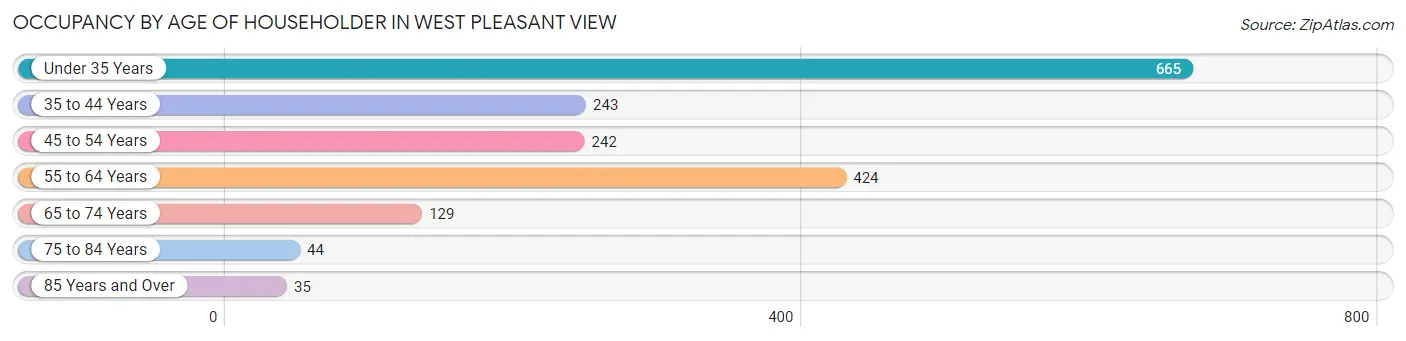
| Age Bracket | # Households | % Households |
| Under 35 Years | 665 | 37.3% |
| 35 to 44 Years | 243 | 13.6% |
| 45 to 54 Years | 242 | 13.6% |
| 55 to 64 Years | 424 | 23.8% |
| 65 to 74 Years | 129 | 7.2% |
| 75 to 84 Years | 44 | 2.5% |
| 85 Years and Over | 35 | 2.0% |
| Total | 1,782 | 100.0% |
Housing Finances in West Pleasant View
Median Income by Occupancy in West Pleasant View
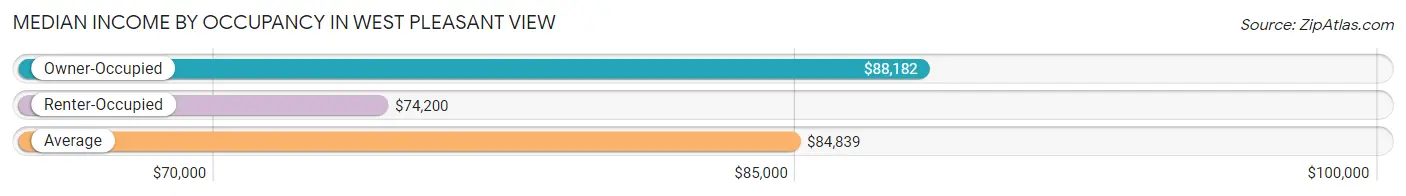
| Occupancy Type | # Households | Median Income |
| Owner-Occupied | 998 (56.0%) | $88,182 |
| Renter-Occupied | 784 (44.0%) | $74,200 |
| Average | 1,782 (100.0%) | $84,839 |
Occupancy by Householder Income Bracket in West Pleasant View
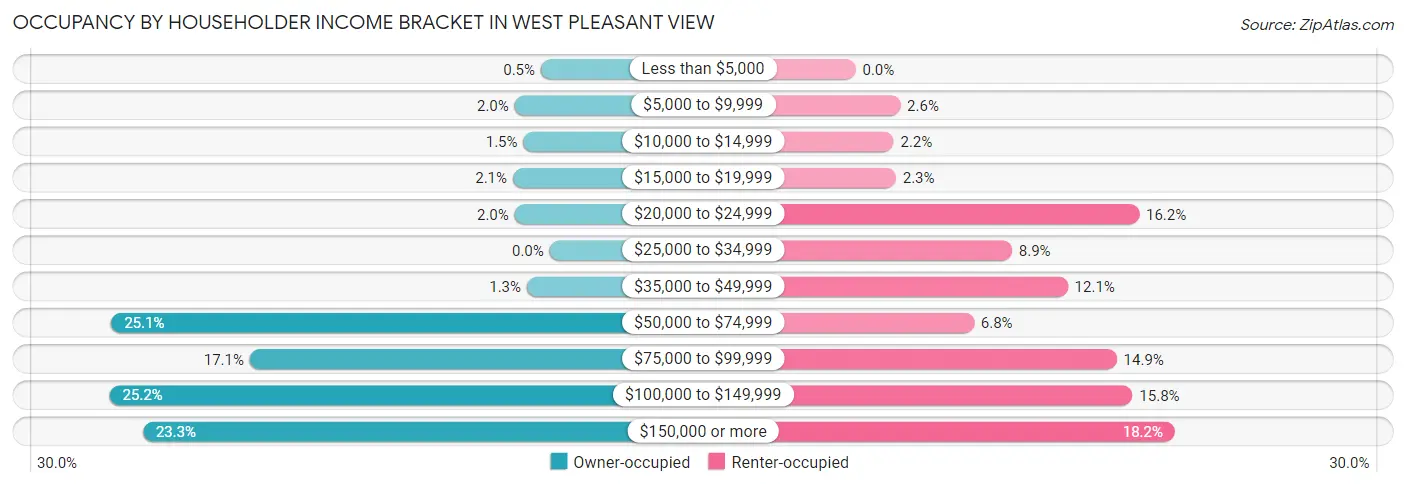
| Income Bracket | Owner-occupied | Renter-occupied |
| Less than $5,000 | 5 (0.5%) | 0 (0.0%) |
| $5,000 to $9,999 | 20 (2.0%) | 20 (2.5%) |
| $10,000 to $14,999 | 15 (1.5%) | 17 (2.2%) |
| $15,000 to $19,999 | 21 (2.1%) | 18 (2.3%) |
| $20,000 to $24,999 | 20 (2.0%) | 127 (16.2%) |
| $25,000 to $34,999 | 0 (0.0%) | 70 (8.9%) |
| $35,000 to $49,999 | 13 (1.3%) | 95 (12.1%) |
| $50,000 to $74,999 | 250 (25.1%) | 53 (6.8%) |
| $75,000 to $99,999 | 171 (17.1%) | 117 (14.9%) |
| $100,000 to $149,999 | 251 (25.2%) | 124 (15.8%) |
| $150,000 or more | 232 (23.3%) | 143 (18.2%) |
| Total | 998 (100.0%) | 784 (100.0%) |
Monthly Housing Cost Tiers in West Pleasant View
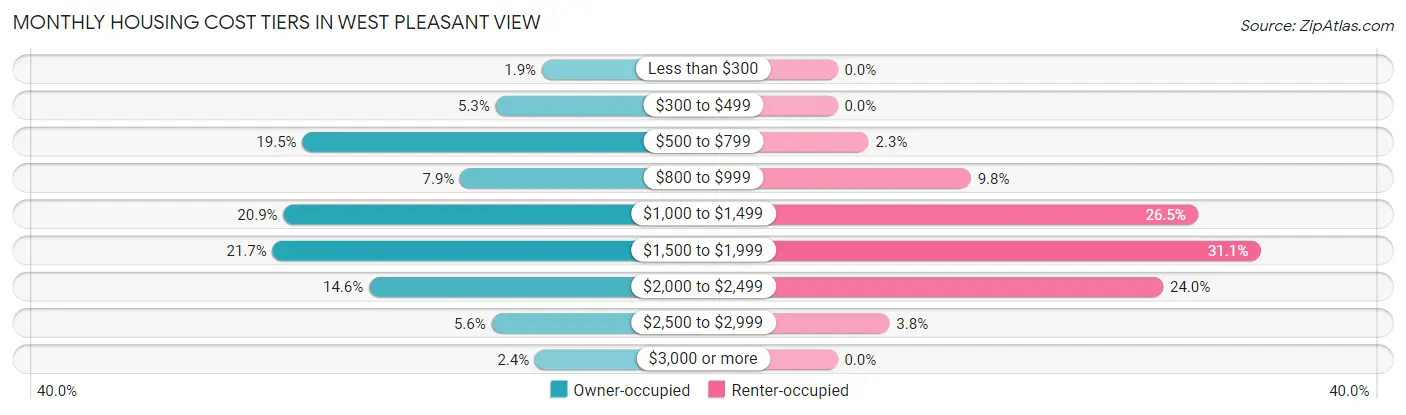
| Monthly Cost | Owner-occupied | Renter-occupied |
| Less than $300 | 19 (1.9%) | 0 (0.0%) |
| $300 to $499 | 53 (5.3%) | 0 (0.0%) |
| $500 to $799 | 195 (19.5%) | 18 (2.3%) |
| $800 to $999 | 79 (7.9%) | 77 (9.8%) |
| $1,000 to $1,499 | 209 (20.9%) | 208 (26.5%) |
| $1,500 to $1,999 | 217 (21.7%) | 244 (31.1%) |
| $2,000 to $2,499 | 146 (14.6%) | 188 (24.0%) |
| $2,500 to $2,999 | 56 (5.6%) | 30 (3.8%) |
| $3,000 or more | 24 (2.4%) | 0 (0.0%) |
| Total | 998 (100.0%) | 784 (100.0%) |
Physical Housing Characteristics in West Pleasant View
Housing Structures in West Pleasant View
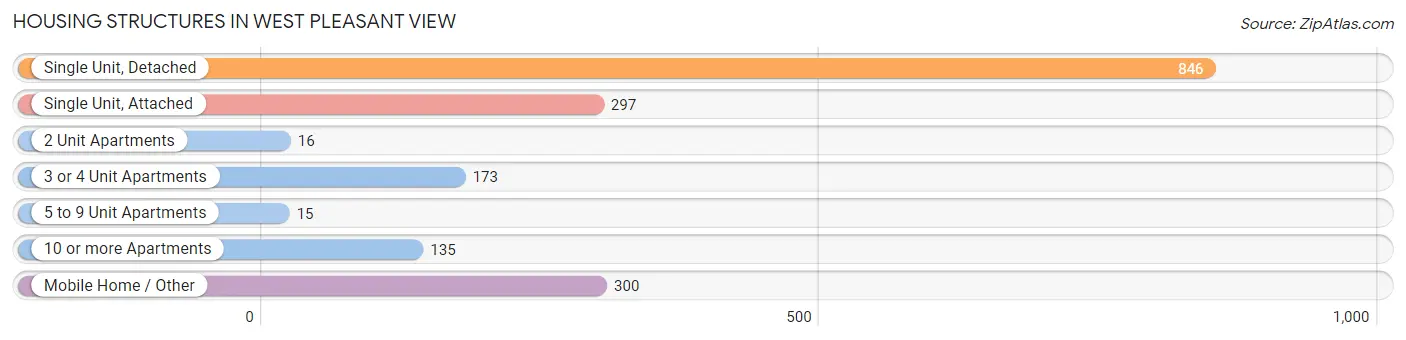
| Structure Type | # Housing Units | % Housing Units |
| Single Unit, Detached | 846 | 47.5% |
| Single Unit, Attached | 297 | 16.7% |
| 2 Unit Apartments | 16 | 0.9% |
| 3 or 4 Unit Apartments | 173 | 9.7% |
| 5 to 9 Unit Apartments | 15 | 0.8% |
| 10 or more Apartments | 135 | 7.6% |
| Mobile Home / Other | 300 | 16.8% |
| Total | 1,782 | 100.0% |
Housing Structures by Occupancy in West Pleasant View
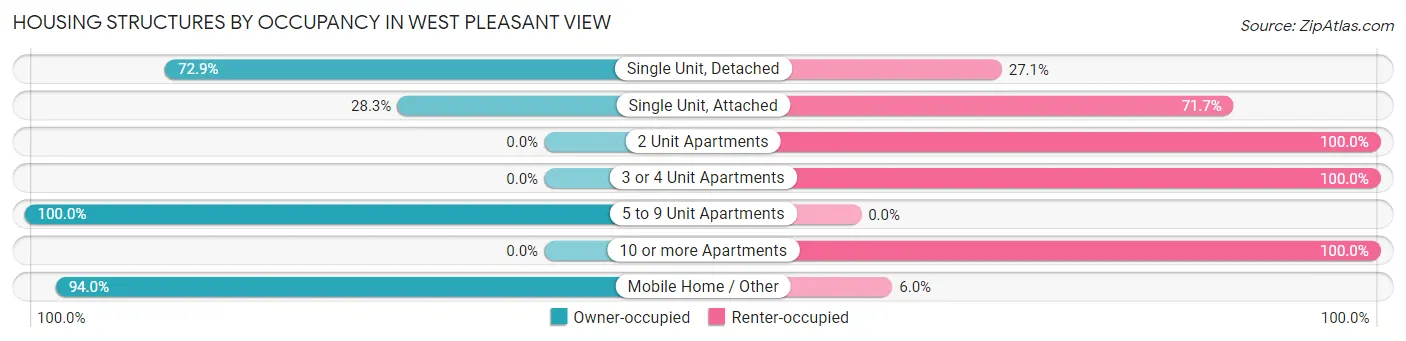
| Structure Type | Owner-occupied | Renter-occupied |
| Single Unit, Detached | 617 (72.9%) | 229 (27.1%) |
| Single Unit, Attached | 84 (28.3%) | 213 (71.7%) |
| 2 Unit Apartments | 0 (0.0%) | 16 (100.0%) |
| 3 or 4 Unit Apartments | 0 (0.0%) | 173 (100.0%) |
| 5 to 9 Unit Apartments | 15 (100.0%) | 0 (0.0%) |
| 10 or more Apartments | 0 (0.0%) | 135 (100.0%) |
| Mobile Home / Other | 282 (94.0%) | 18 (6.0%) |
| Total | 998 (56.0%) | 784 (44.0%) |
Housing Structures by Number of Rooms in West Pleasant View
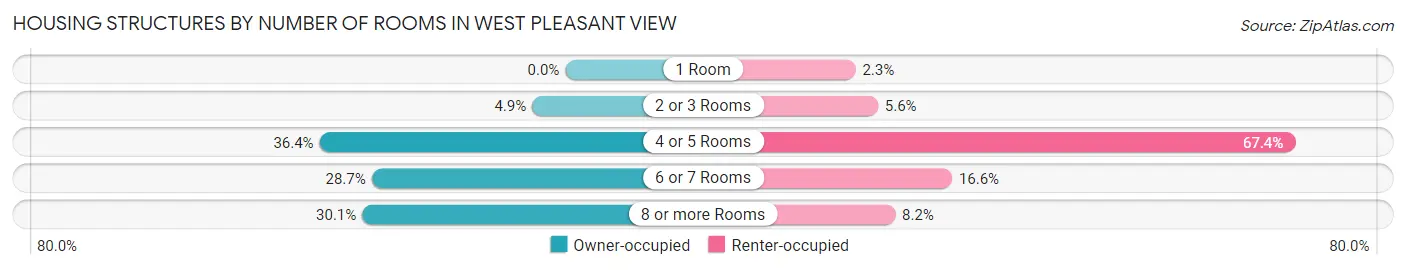
| Number of Rooms | Owner-occupied | Renter-occupied |
| 1 Room | 0 (0.0%) | 18 (2.3%) |
| 2 or 3 Rooms | 49 (4.9%) | 44 (5.6%) |
| 4 or 5 Rooms | 363 (36.4%) | 528 (67.3%) |
| 6 or 7 Rooms | 286 (28.7%) | 130 (16.6%) |
| 8 or more Rooms | 300 (30.1%) | 64 (8.2%) |
| Total | 998 (100.0%) | 784 (100.0%) |
Housing Structure by Heating Type in West Pleasant View
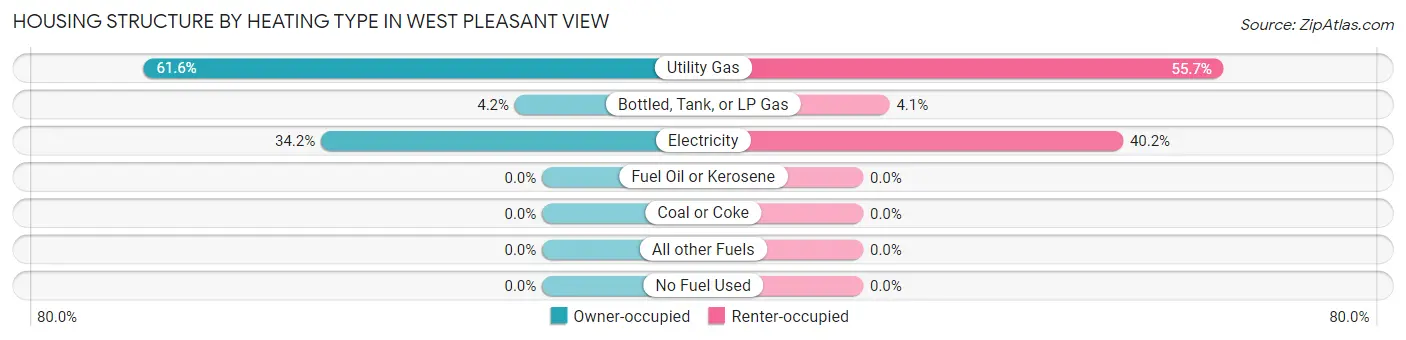
| Heating Type | Owner-occupied | Renter-occupied |
| Utility Gas | 615 (61.6%) | 437 (55.7%) |
| Bottled, Tank, or LP Gas | 42 (4.2%) | 32 (4.1%) |
| Electricity | 341 (34.2%) | 315 (40.2%) |
| Fuel Oil or Kerosene | 0 (0.0%) | 0 (0.0%) |
| Coal or Coke | 0 (0.0%) | 0 (0.0%) |
| All other Fuels | 0 (0.0%) | 0 (0.0%) |
| No Fuel Used | 0 (0.0%) | 0 (0.0%) |
| Total | 998 (100.0%) | 784 (100.0%) |
Household Vehicle Usage in West Pleasant View
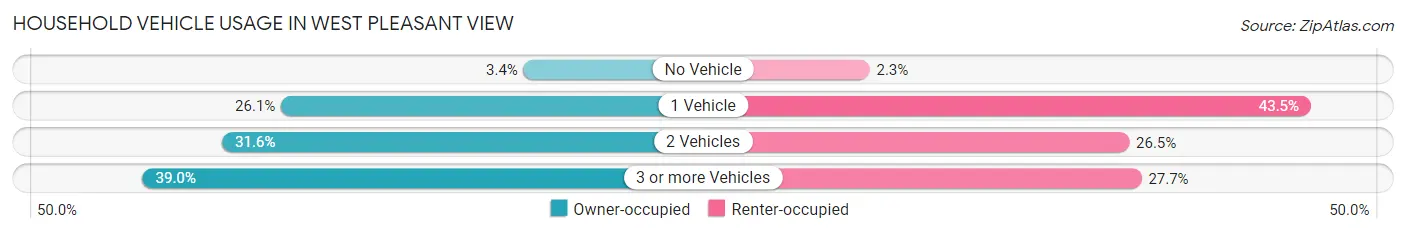
| Vehicles per Household | Owner-occupied | Renter-occupied |
| No Vehicle | 34 (3.4%) | 18 (2.3%) |
| 1 Vehicle | 260 (26.1%) | 341 (43.5%) |
| 2 Vehicles | 315 (31.6%) | 208 (26.5%) |
| 3 or more Vehicles | 389 (39.0%) | 217 (27.7%) |
| Total | 998 (100.0%) | 784 (100.0%) |
Real Estate & Mortgages in West Pleasant View
Real Estate and Mortgage Overview in West Pleasant View
| Characteristic | Without Mortgage | With Mortgage |
| Housing Units | 351 | 647 |
| Median Property Value | $270,400 | $449,600 |
| Median Household Income | $56,800 | $215 |
| Monthly Housing Costs | $926 | $24 |
| Real Estate Taxes | - | - |
Property Value by Mortgage Status in West Pleasant View
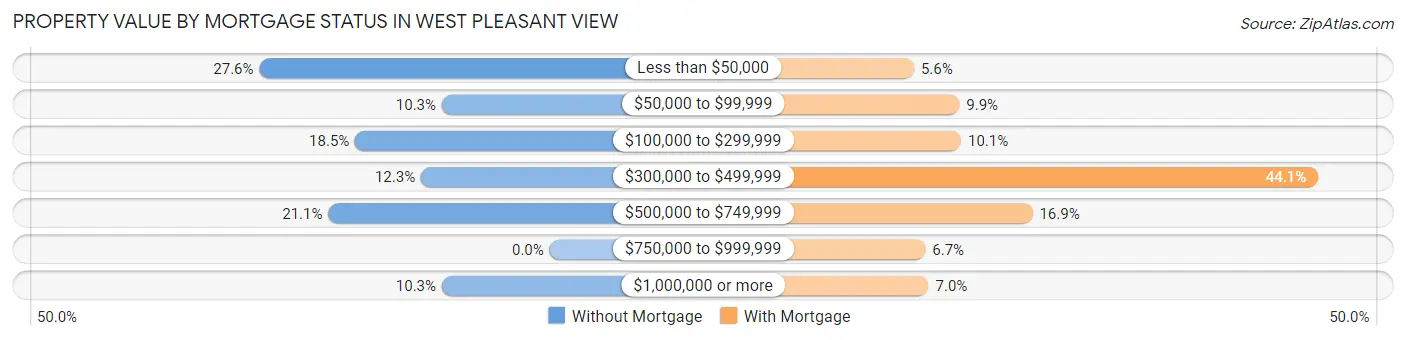
| Property Value | Without Mortgage | With Mortgage |
| Less than $50,000 | 97 (27.6%) | 36 (5.6%) |
| $50,000 to $99,999 | 36 (10.3%) | 64 (9.9%) |
| $100,000 to $299,999 | 65 (18.5%) | 65 (10.1%) |
| $300,000 to $499,999 | 43 (12.2%) | 285 (44.1%) |
| $500,000 to $749,999 | 74 (21.1%) | 109 (16.9%) |
| $750,000 to $999,999 | 0 (0.0%) | 43 (6.7%) |
| $1,000,000 or more | 36 (10.3%) | 45 (7.0%) |
| Total | 351 (100.0%) | 647 (100.0%) |
Household Income by Mortgage Status in West Pleasant View
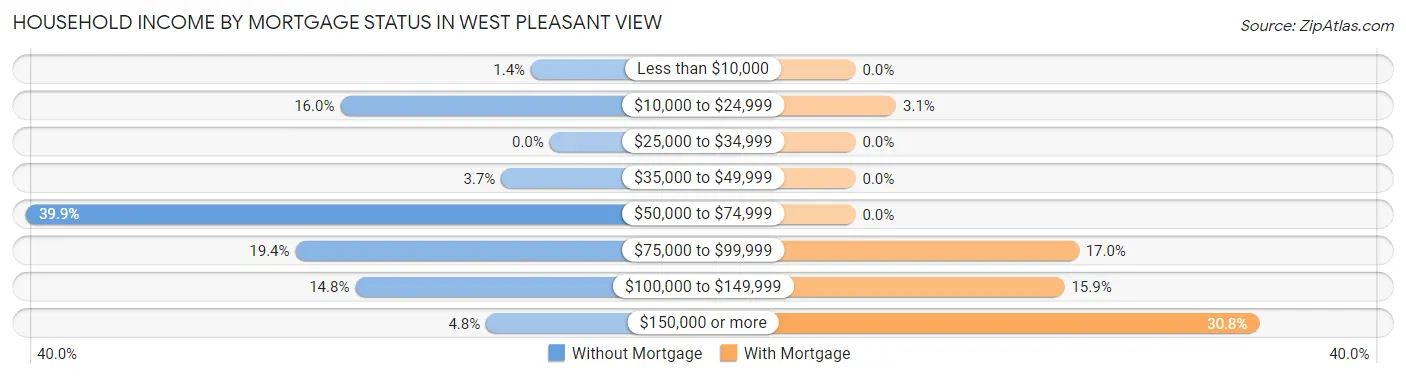
| Household Income | Without Mortgage | With Mortgage |
| Less than $10,000 | 5 (1.4%) | 0 (0.0%) |
| $10,000 to $24,999 | 56 (16.0%) | 20 (3.1%) |
| $25,000 to $34,999 | 0 (0.0%) | 0 (0.0%) |
| $35,000 to $49,999 | 13 (3.7%) | 0 (0.0%) |
| $50,000 to $74,999 | 140 (39.9%) | 0 (0.0%) |
| $75,000 to $99,999 | 68 (19.4%) | 110 (17.0%) |
| $100,000 to $149,999 | 52 (14.8%) | 103 (15.9%) |
| $150,000 or more | 17 (4.8%) | 199 (30.8%) |
| Total | 351 (100.0%) | 647 (100.0%) |
Property Value to Household Income Ratio in West Pleasant View
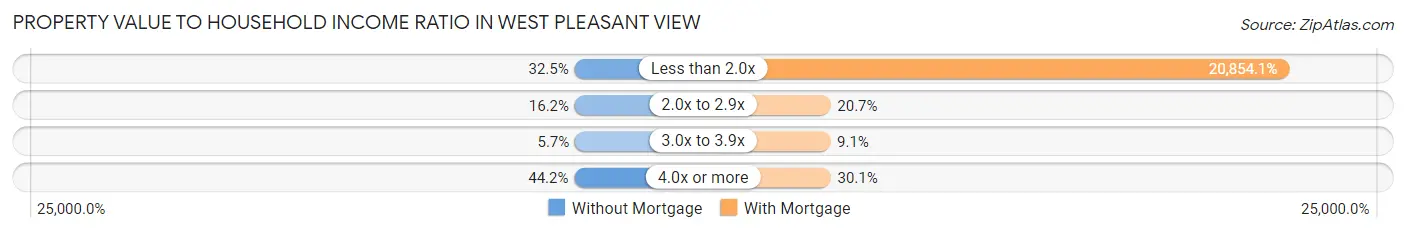
| Value-to-Income Ratio | Without Mortgage | With Mortgage |
| Less than 2.0x | 114 (32.5%) | 134,926 (20,854.1%) |
| 2.0x to 2.9x | 57 (16.2%) | 134 (20.7%) |
| 3.0x to 3.9x | 20 (5.7%) | 59 (9.1%) |
| 4.0x or more | 155 (44.2%) | 195 (30.1%) |
| Total | 351 (100.0%) | 647 (100.0%) |
Real Estate Taxes by Mortgage Status in West Pleasant View
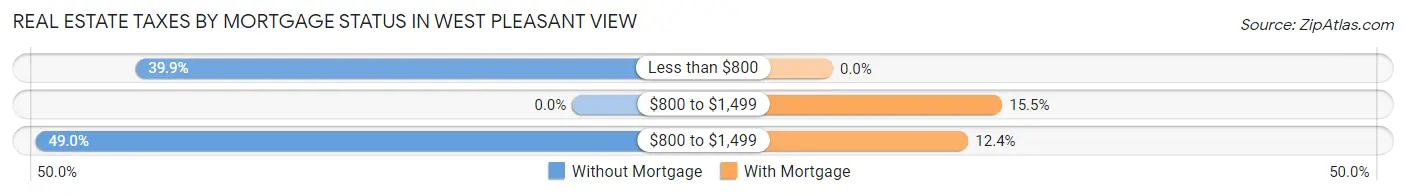
| Property Taxes | Without Mortgage | With Mortgage |
| Less than $800 | 140 (39.9%) | 0 (0.0%) |
| $800 to $1,499 | 0 (0.0%) | 100 (15.5%) |
| $800 to $1,499 | 172 (49.0%) | 80 (12.4%) |
| Total | 351 (100.0%) | 647 (100.0%) |
Health & Disability in West Pleasant View
Health Insurance Coverage by Age in West Pleasant View
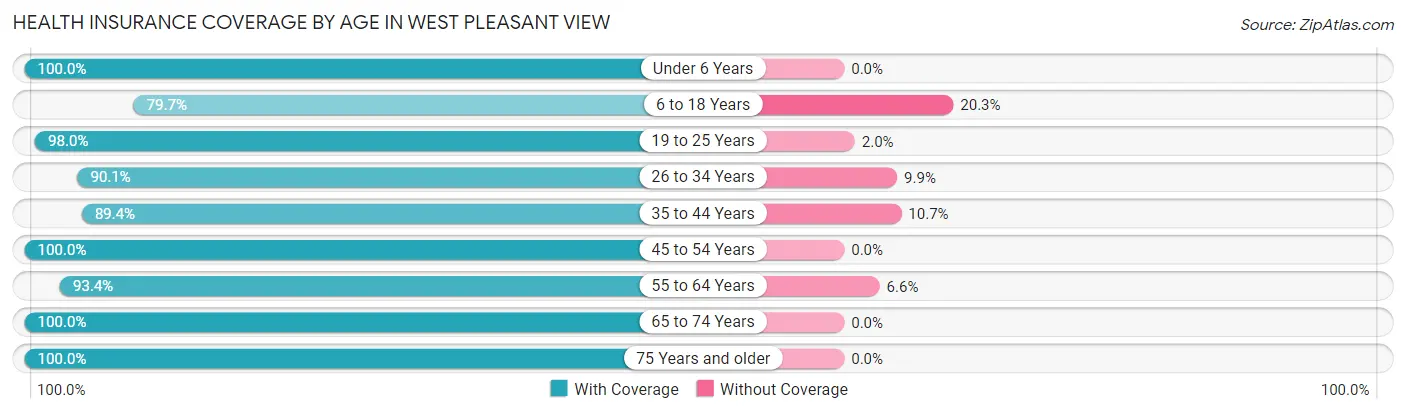
| Age Bracket | With Coverage | Without Coverage |
| Under 6 Years | 446 (100.0%) | 0 (0.0%) |
| 6 to 18 Years | 521 (79.7%) | 133 (20.3%) |
| 19 to 25 Years | 696 (98.0%) | 14 (2.0%) |
| 26 to 34 Years | 878 (90.1%) | 96 (9.9%) |
| 35 to 44 Years | 470 (89.3%) | 56 (10.6%) |
| 45 to 54 Years | 399 (100.0%) | 0 (0.0%) |
| 55 to 64 Years | 652 (93.4%) | 46 (6.6%) |
| 65 to 74 Years | 253 (100.0%) | 0 (0.0%) |
| 75 Years and older | 149 (100.0%) | 0 (0.0%) |
| Total | 4,464 (92.8%) | 345 (7.2%) |
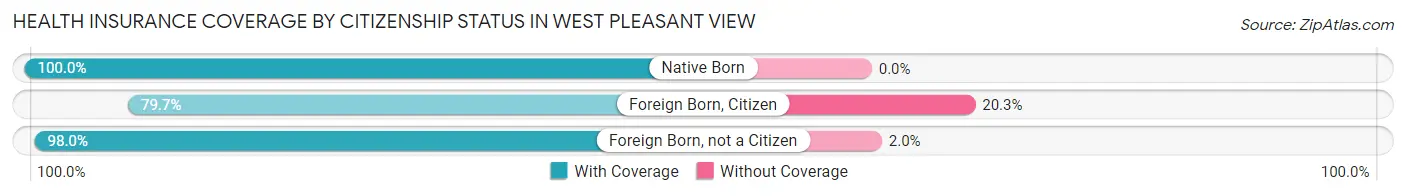
Health Insurance Coverage by Citizenship Status in West Pleasant View
| Citizenship Status | With Coverage | Without Coverage |
| Native Born | 446 (100.0%) | 0 (0.0%) |
| Foreign Born, Citizen | 521 (79.7%) | 133 (20.3%) |
| Foreign Born, not a Citizen | 696 (98.0%) | 14 (2.0%) |
Health Insurance Coverage by Household Income in West Pleasant View
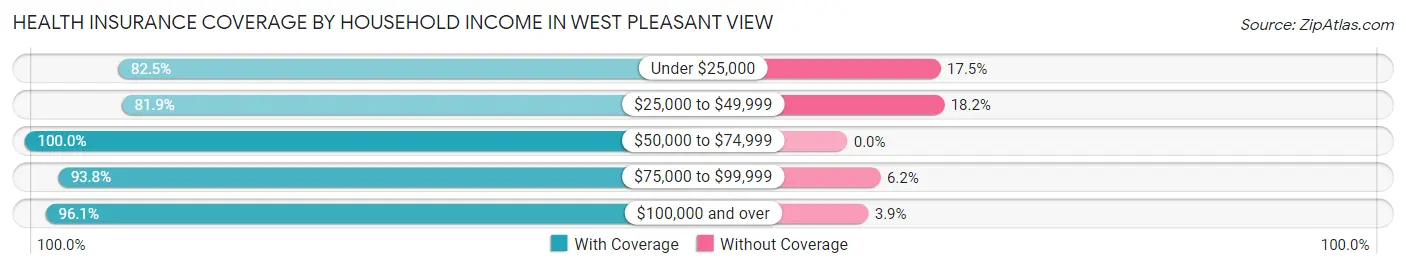
| Household Income | With Coverage | Without Coverage |
| Under $25,000 | 543 (82.5%) | 115 (17.5%) |
| $25,000 to $49,999 | 406 (81.9%) | 90 (18.1%) |
| $50,000 to $74,999 | 597 (100.0%) | 0 (0.0%) |
| $75,000 to $99,999 | 815 (93.8%) | 54 (6.2%) |
| $100,000 and over | 2,103 (96.1%) | 86 (3.9%) |
Public vs Private Health Insurance Coverage by Age in West Pleasant View
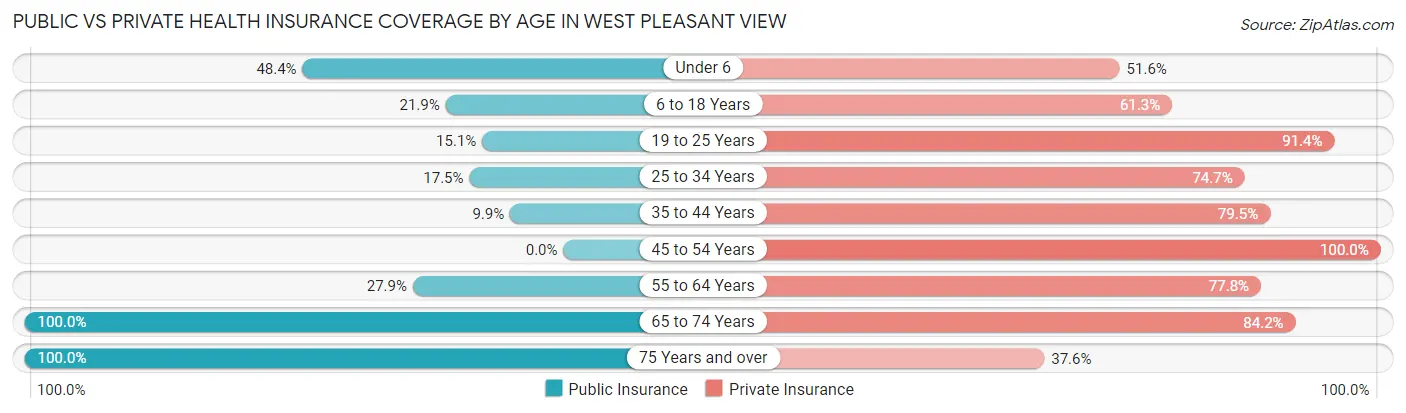
| Age Bracket | Public Insurance | Private Insurance |
| Under 6 | 216 (48.4%) | 230 (51.6%) |
| 6 to 18 Years | 143 (21.9%) | 401 (61.3%) |
| 19 to 25 Years | 107 (15.1%) | 649 (91.4%) |
| 25 to 34 Years | 170 (17.4%) | 728 (74.7%) |
| 35 to 44 Years | 52 (9.9%) | 418 (79.5%) |
| 45 to 54 Years | 0 (0.0%) | 399 (100.0%) |
| 55 to 64 Years | 195 (27.9%) | 543 (77.8%) |
| 65 to 74 Years | 253 (100.0%) | 213 (84.2%) |
| 75 Years and over | 149 (100.0%) | 56 (37.6%) |
| Total | 1,285 (26.7%) | 3,637 (75.6%) |
Disability Status by Sex by Age in West Pleasant View
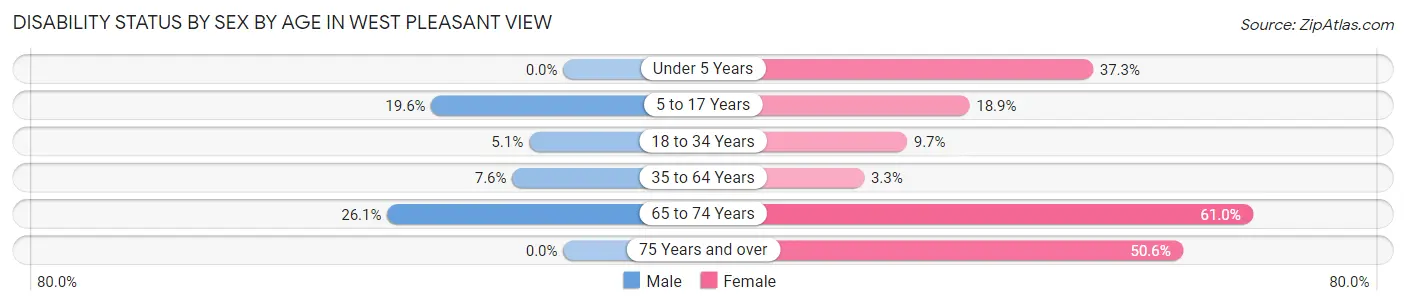
| Age Bracket | Male | Female |
| Under 5 Years | 0 (0.0%) | 60 (37.3%) |
| 5 to 17 Years | 58 (19.6%) | 81 (18.9%) |
| 18 to 34 Years | 39 (5.1%) | 92 (9.7%) |
| 35 to 64 Years | 63 (7.6%) | 26 (3.3%) |
| 65 to 74 Years | 40 (26.1%) | 61 (61.0%) |
| 75 Years and over | 0 (0.0%) | 42 (50.6%) |
Disability Class by Sex by Age in West Pleasant View
Disability Class: Hearing Difficulty
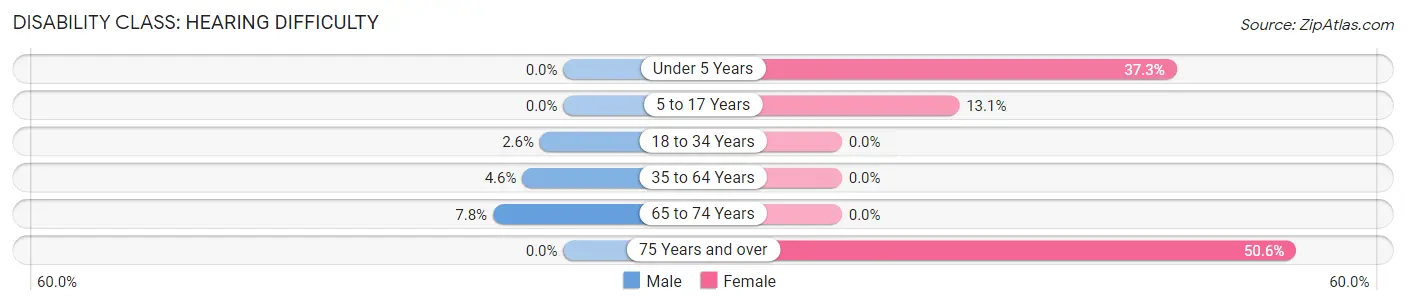
| Age Bracket | Male | Female |
| Under 5 Years | 0 (0.0%) | 60 (37.3%) |
| 5 to 17 Years | 0 (0.0%) | 56 (13.1%) |
| 18 to 34 Years | 20 (2.6%) | 0 (0.0%) |
| 35 to 64 Years | 38 (4.6%) | 0 (0.0%) |
| 65 to 74 Years | 12 (7.8%) | 0 (0.0%) |
| 75 Years and over | 0 (0.0%) | 42 (50.6%) |
Disability Class: Vision Difficulty
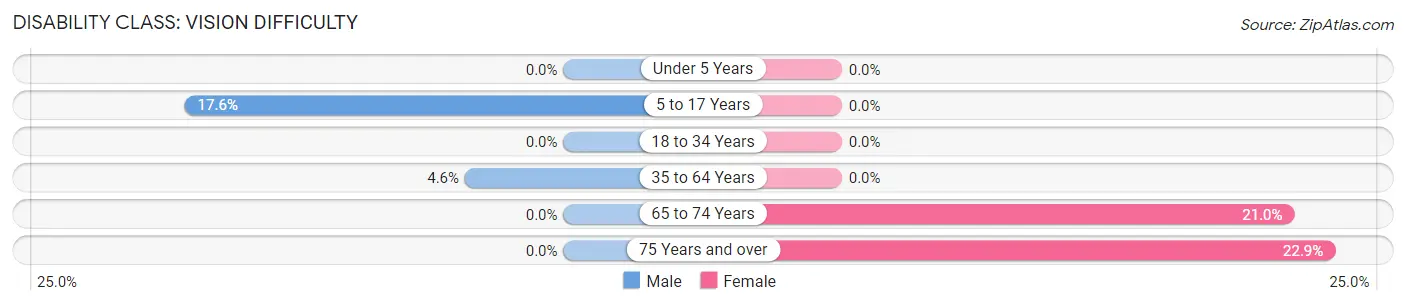
| Age Bracket | Male | Female |
| Under 5 Years | 0 (0.0%) | 0 (0.0%) |
| 5 to 17 Years | 52 (17.6%) | 0 (0.0%) |
| 18 to 34 Years | 0 (0.0%) | 0 (0.0%) |
| 35 to 64 Years | 38 (4.6%) | 0 (0.0%) |
| 65 to 74 Years | 0 (0.0%) | 21 (21.0%) |
| 75 Years and over | 0 (0.0%) | 19 (22.9%) |
Disability Class: Cognitive Difficulty
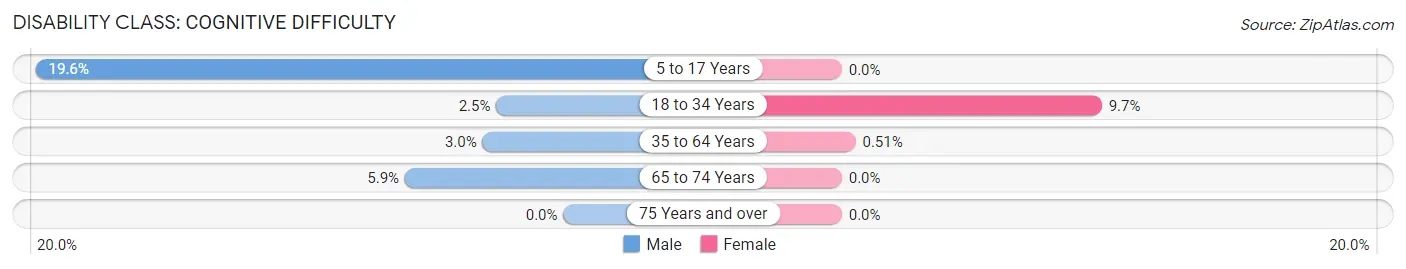
| Age Bracket | Male | Female |
| 5 to 17 Years | 58 (19.6%) | 0 (0.0%) |
| 18 to 34 Years | 19 (2.5%) | 92 (9.7%) |
| 35 to 64 Years | 25 (3.0%) | 4 (0.5%) |
| 65 to 74 Years | 9 (5.9%) | 0 (0.0%) |
| 75 Years and over | 0 (0.0%) | 0 (0.0%) |
Disability Class: Ambulatory Difficulty
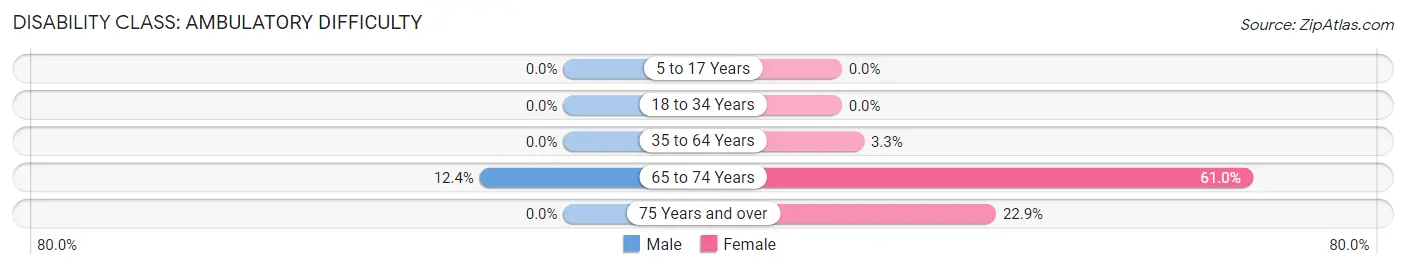
| Age Bracket | Male | Female |
| 5 to 17 Years | 0 (0.0%) | 0 (0.0%) |
| 18 to 34 Years | 0 (0.0%) | 0 (0.0%) |
| 35 to 64 Years | 0 (0.0%) | 26 (3.3%) |
| 65 to 74 Years | 19 (12.4%) | 61 (61.0%) |
| 75 Years and over | 0 (0.0%) | 19 (22.9%) |
Disability Class: Self-Care Difficulty
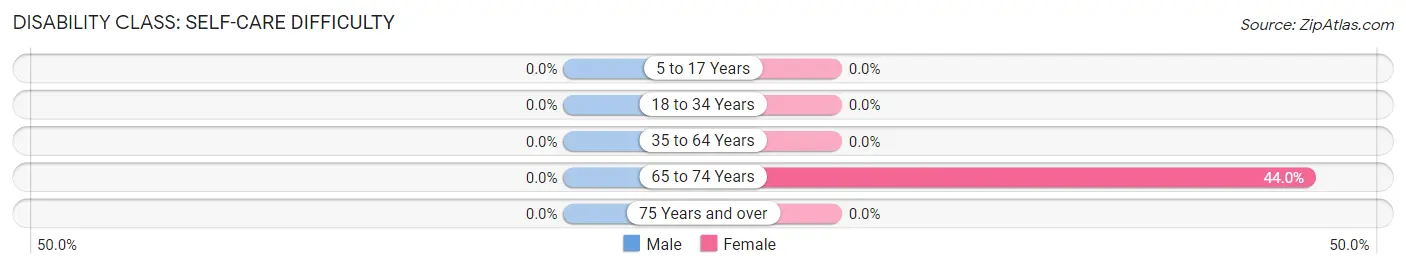
| Age Bracket | Male | Female |
| 5 to 17 Years | 0 (0.0%) | 0 (0.0%) |
| 18 to 34 Years | 0 (0.0%) | 0 (0.0%) |
| 35 to 64 Years | 0 (0.0%) | 0 (0.0%) |
| 65 to 74 Years | 0 (0.0%) | 44 (44.0%) |
| 75 Years and over | 0 (0.0%) | 0 (0.0%) |
Technology Access in West Pleasant View
Computing Device Access in West Pleasant View
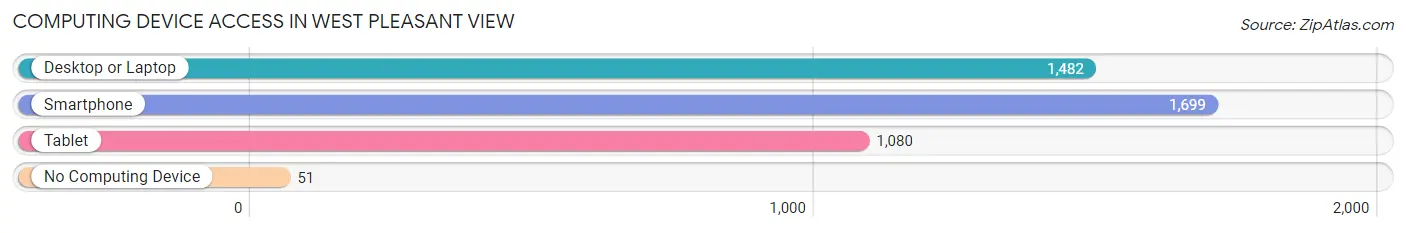
| Device Type | # Households | % Households |
| Desktop or Laptop | 1,482 | 83.2% |
| Smartphone | 1,699 | 95.3% |
| Tablet | 1,080 | 60.6% |
| No Computing Device | 51 | 2.9% |
| Total | 1,782 | 100.0% |
Internet Access in West Pleasant View
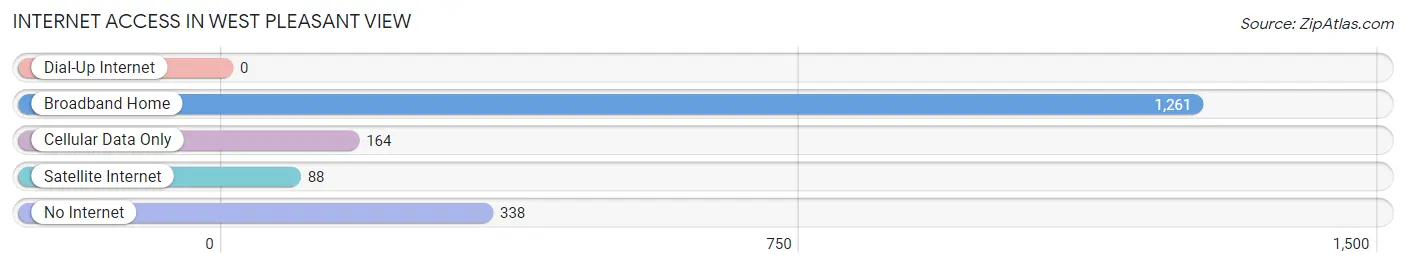
| Internet Type | # Households | % Households |
| Dial-Up Internet | 0 | 0.0% |
| Broadband Home | 1,261 | 70.8% |
| Cellular Data Only | 164 | 9.2% |
| Satellite Internet | 88 | 4.9% |
| No Internet | 338 | 19.0% |
| Total | 1,782 | 100.0% |
West Pleasant View Summary
History
West Pleasant View is a small unincorporated community located in Jefferson County, Colorado. It is situated in the foothills of the Rocky Mountains, approximately 15 miles west of Denver. The area was first settled in the late 1800s by homesteaders who were attracted to the area’s abundant natural resources. The community was officially established in 1891 and was named after the pleasant view of the mountains from the area.
The early settlers of West Pleasant View were primarily farmers and ranchers who raised cattle and grew crops such as wheat, oats, and hay. The area was also home to several small businesses, including a general store, a blacksmith shop, and a post office. The community was also home to a school, which was built in 1895 and served the area until it closed in the 1950s.
In the early 1900s, the area began to experience a population boom as more people moved to the area to take advantage of the area’s natural resources. This growth was further fueled by the construction of the Denver and Rio Grande Western Railroad, which ran through the area and provided access to the larger cities of Denver and Boulder.
Geography
West Pleasant View is located in the foothills of the Rocky Mountains, approximately 15 miles west of Denver. The area is characterized by rolling hills, open meadows, and dense forests. The area is also home to several small streams and creeks, which provide a source of water for the area’s residents.
The area is located at an elevation of approximately 6,000 feet, which provides a cooler climate than the surrounding areas. The area receives an average of 20 inches of precipitation per year, with most of it falling in the form of snow during the winter months.
Economy
The economy of West Pleasant View is primarily based on agriculture and tourism. The area is home to several small farms and ranches, which produce a variety of crops and livestock. The area is also home to several small businesses, including a general store, a blacksmith shop, and a post office.
The area is also a popular tourist destination, as it is located close to several popular attractions, including the Rocky Mountain National Park and the Denver Zoo. The area is also home to several small bed and breakfasts, which provide lodging for visitors to the area.
Demographics
As of the 2010 census, the population of West Pleasant View was 1,845. The population is primarily white (94.3%), with small percentages of Hispanic (2.2%), African American (1.2%), and Asian (0.7%) residents. The median household income in the area is $60,000, and the median home value is $400,000. The area is served by the Jefferson County School District, which provides public education to the area’s students.
Common Questions
What is the Total Population of West Pleasant View?
Total Population of West Pleasant View is 5,197.
What is the Total Male Population of West Pleasant View?
Total Male Population of West Pleasant View is 2,654.
What is the Total Female Population of West Pleasant View?
Total Female Population of West Pleasant View is 2,543.
What is the Ratio of Males per 100 Females in West Pleasant View?
There are 104.36 Males per 100 Females in West Pleasant View.
What is the Ratio of Females per 100 Males in West Pleasant View?
There are 95.82 Females per 100 Males in West Pleasant View.
What is the Median Population Age in West Pleasant View?
Median Population Age in West Pleasant View is 32.0 Years.
What is the Average Family Size in West Pleasant View
Average Family Size in West Pleasant View is 2.9 People.
What is the Average Household Size in West Pleasant View
Average Household Size in West Pleasant View is 2.7 People.
What is Per Capita Income in West Pleasant View?
Per Capita income in West Pleasant View is $33,751.
What is the Median Family Income in West Pleasant View?
Median Family Income in West Pleasant View is $71,538.
What is the Median Household income in West Pleasant View?
Median Household Income in West Pleasant View is $84,839.
What is Income or Wage Gap in West Pleasant View?
Income or Wage Gap in West Pleasant View is 58.1%.
Women in West Pleasant View earn 41.9 cents for every dollar earned by a man.
What is Inequality or Gini Index in West Pleasant View?
Inequality or Gini Index in West Pleasant View is 0.38.
How Large is the Labor Force in West Pleasant View?
There are 2,800 People in the Labor Forcein in West Pleasant View.
What is the Percentage of People in the Labor Force in West Pleasant View?
65.6% of People are in the Labor Force in West Pleasant View.
What is the Unemployment Rate in West Pleasant View?
Unemployment Rate in West Pleasant View is 5.4%.