Zip Codes with the Highest Percentage of Population Employed in Farming, Fishing & Forestry in Broomfield, CO
RELATED REPORTS & OPTIONS
Farming, Fishing & Forestry
Broomfield
Compare Zip Codes
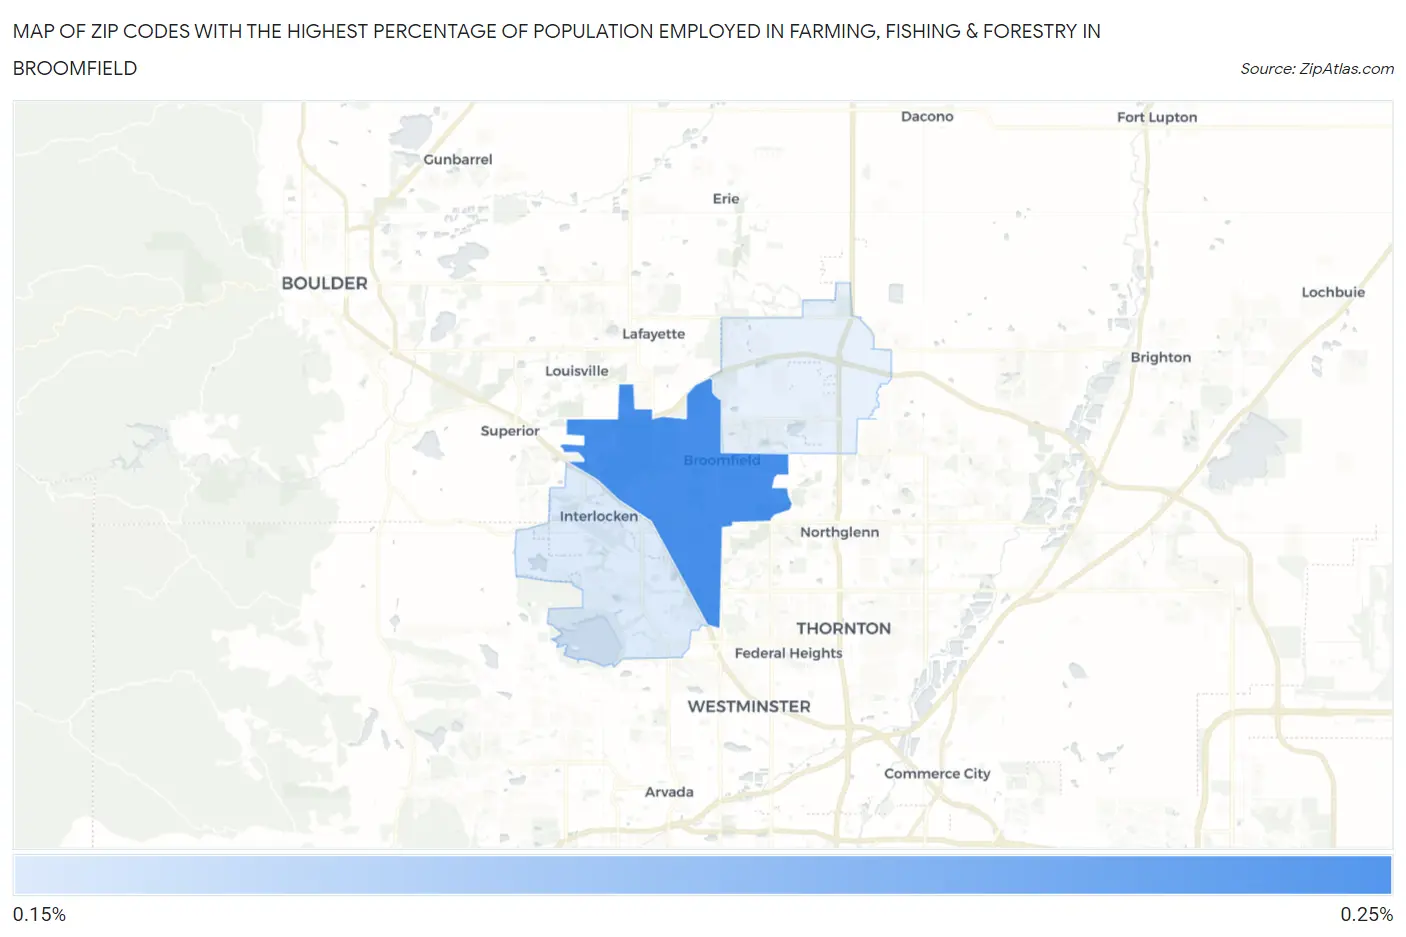
Map of Zip Codes with the Highest Percentage of Population Employed in Farming, Fishing & Forestry in Broomfield
0.0%
0.25%
Zip Codes with the Highest Percentage of Population Employed in Farming, Fishing & Forestry in Broomfield, CO
| Zip Code | % Employed | vs State | vs National | |
| 1. | 80020 | 0.23% | 0.49%(-0.256)#262 | 0.61%(-0.374)#15,671 |
| 2. | 80021 | 0.22% | 0.49%(-0.263)#266 | 0.61%(-0.382)#15,783 |
1
Common Questions
What are the Top Zip Codes with the Highest Percentage of Population Employed in Farming, Fishing & Forestry in Broomfield, CO?
Top Zip Codes with the Highest Percentage of Population Employed in Farming, Fishing & Forestry in Broomfield, CO are:
What zip code has the Highest Percentage of Population Employed in Farming, Fishing & Forestry in Broomfield, CO?
80020 has the Highest Percentage of Population Employed in Farming, Fishing & Forestry in Broomfield, CO with 0.23%.
What is the Percentage of Population Employed in Farming, Fishing & Forestry in Broomfield, CO?
Percentage of Population Employed in Farming, Fishing & Forestry in Broomfield is 0.10%.
What is the Percentage of Population Employed in Farming, Fishing & Forestry in Colorado?
Percentage of Population Employed in Farming, Fishing & Forestry in Colorado is 0.49%.
What is the Percentage of Population Employed in Farming, Fishing & Forestry in the United States?
Percentage of Population Employed in Farming, Fishing & Forestry in the United States is 0.61%.