Zip Codes with the Highest Percentage of Population with a Degree in Literature and Languages in Broomfield, CO

RELATED REPORTS & OPTIONS

Literature and Languages
Population
Families and Households
Female Fertility
Female Fertility (Unmarried)
Race (Community Size)
Race (Percentage)
Ancestry (Community Size)
AfricanAmericanApacheArabArgentineanArmenianAustralianAustrianBangladeshiBelgianBhutaneseBlackfeetBrazilianBritishBulgarianBurmeseCanadianCentral AmericanCentral American IndianCherokeeCheyenneChoctawColombianCroatianCubanCzechCzechoslovakianDanishDominicanDutchEastern EuropeanEcuadorianEgyptianEnglishEstonianEuropeanFinnishFrenchFrench CanadianGermanGreekGuamanian / ChamorroGuatemalanHungarianIndian (Asian)IranianIraqiIrishItalianJamaicanJapaneseKoreanLatvianLebaneseLithuanianMalaysianMexicanMexican American IndianMongolianMoroccanNative HawaiianNavajoNorthern EuropeanNorwegianPakistaniPalestinianPeruvianPolishPortuguesePotawatomiPuebloPuerto RicanRomanianRussianSalvadoranScandinavianScotch-IrishScottishSerbianSiouxSlavicSlovakSloveneSouth AmericanSpaniardSpanishSri LankanSubsaharan AfricanSwedishSwissThaiTurkishUkrainianUteVenezuelanWelshYugoslavian
Ancestry (Percentage)
AfricanAmericanApacheArabArgentineanArmenianAustralianAustrianBangladeshiBelgianBhutaneseBlackfeetBrazilianBritishBulgarianBurmeseCanadianCentral AmericanCentral American IndianCherokeeCheyenneChoctawColombianCroatianCubanCzechCzechoslovakianDanishDominicanDutchEastern EuropeanEcuadorianEgyptianEnglishEstonianEuropeanFinnishFrenchFrench CanadianGermanGreekGuamanian / ChamorroGuatemalanHungarianIndian (Asian)IranianIraqiIrishItalianJamaicanJapaneseKoreanLatvianLebaneseLithuanianMalaysianMexicanMexican American IndianMongolianMoroccanNative HawaiianNavajoNorthern EuropeanNorwegianPakistaniPalestinianPeruvianPolishPortuguesePotawatomiPuebloPuerto RicanRomanianRussianSalvadoranScandinavianScotch-IrishScottishSerbianSiouxSlavicSlovakSloveneSouth AmericanSpaniardSpanishSri LankanSubsaharan AfricanSwedishSwissThaiTurkishUkrainianUteVenezuelanWelshYugoslavian
Immigrant Origin (Total)
Immigrant Origin (Percentage)
Income
Income (Families)
Income (Households)
Poverty
Poverty (Families)
Unemployment
Employment Occupations
Employment Industries
Employer Class
Commute Time
Commute Means
School Enrollment
Education by Degree Field
Occupancy
Finances
Physical Characteristics
Broomfield
Compare Zip Codes
Comparison Subject

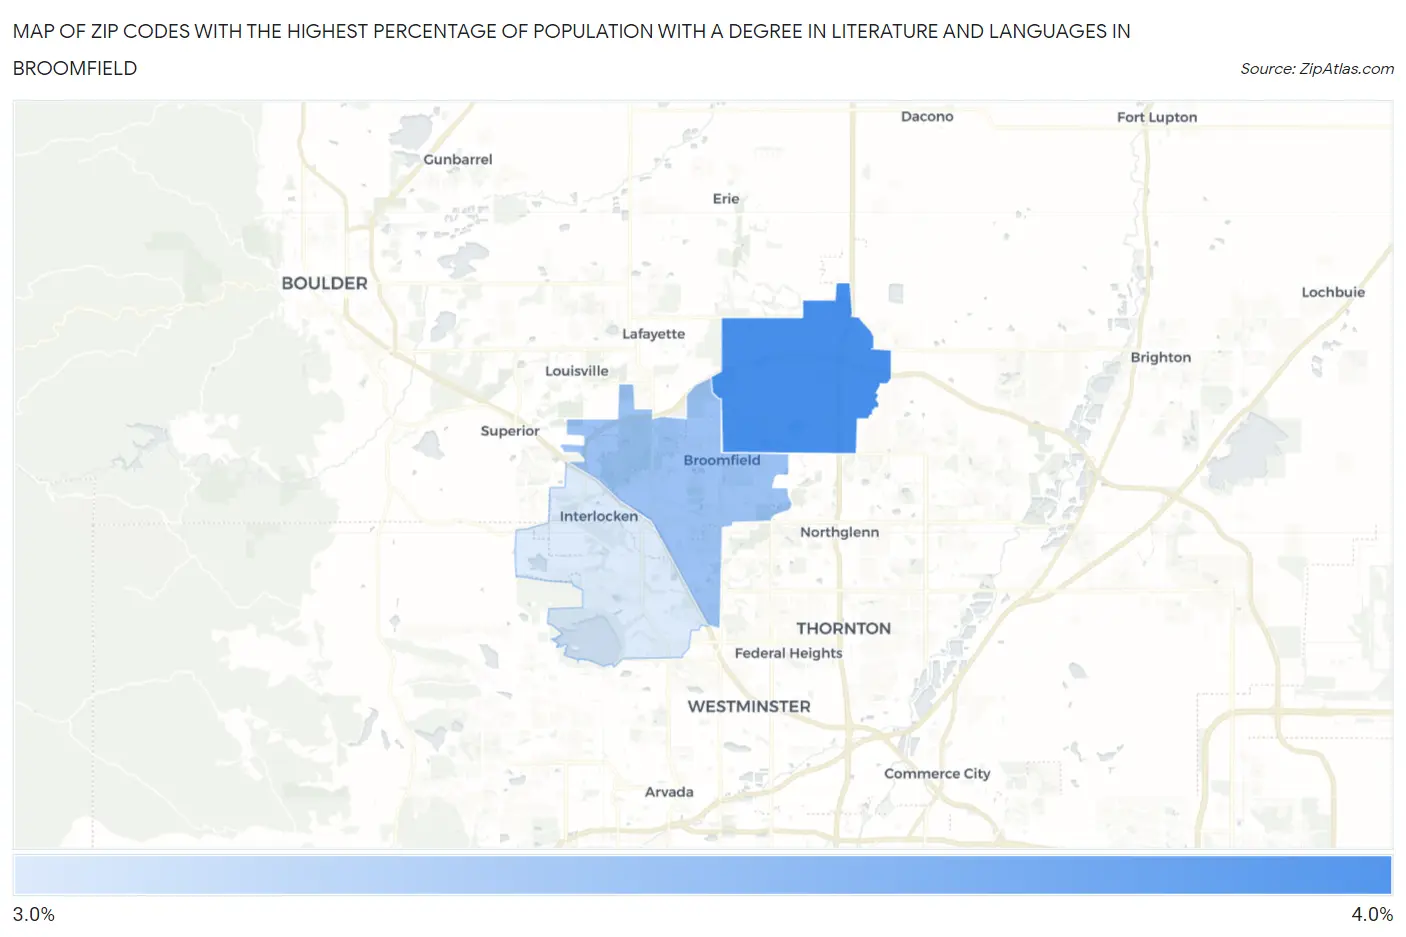
Map of Zip Codes with the Highest Percentage of Population with a Degree in Literature and Languages in Broomfield

0.0%
4.0%
Zip Codes with the Highest Percentage of Population with a Degree in Literature and Languages in Broomfield Map

Zip Codes with the Highest Percentage of Population with a Degree in Literature and Languages in Broomfield, CO

Zip Code % Graduates vs State vs National
1.800233.9%4.6%(-0.734)#2074.4%(-0.520)#10,529
2.800203.7%4.6%(-0.943)#2224.4%(-0.729)#11,232
3.800213.5%4.6%(-1.10)#2334.4%(-0.889)#11,785

Common Questions

What are the Top Zip Codes with the Highest Percentage of Population with a Degree in Literature and Languages in Broomfield, CO?
Top Zip Codes with the Highest Percentage of Population with a Degree in Literature and Languages in Broomfield, CO are:
#1
3.9%
#2
3.7%
#3
3.5%
What zip code has the Highest Percentage of Population with a Degree in Literature and Languages in Broomfield, CO?
80023 has the Highest Percentage of Population with a Degree in Literature and Languages in Broomfield, CO with 3.9%.
What is the Percentage of Population with a Degree in Literature and Languages in Broomfield, CO?
Percentage of Population with a Degree in Literature and Languages in Broomfield is 3.7%.
What is the Percentage of Population with a Degree in Literature and Languages in Colorado?
Percentage of Population with a Degree in Literature and Languages in Colorado is 4.6%.
What is the Percentage of Population with a Degree in Literature and Languages in the United States?
Percentage of Population with a Degree in Literature and Languages in the United States is 4.4%.