Zip Codes with the Highest Percentage of Population Employed in Arts, Entertainment & Recreation in Monterey Park, CA
RELATED REPORTS & OPTIONS
Arts, Entertainment & Recreation
Monterey Park
Compare Zip Codes
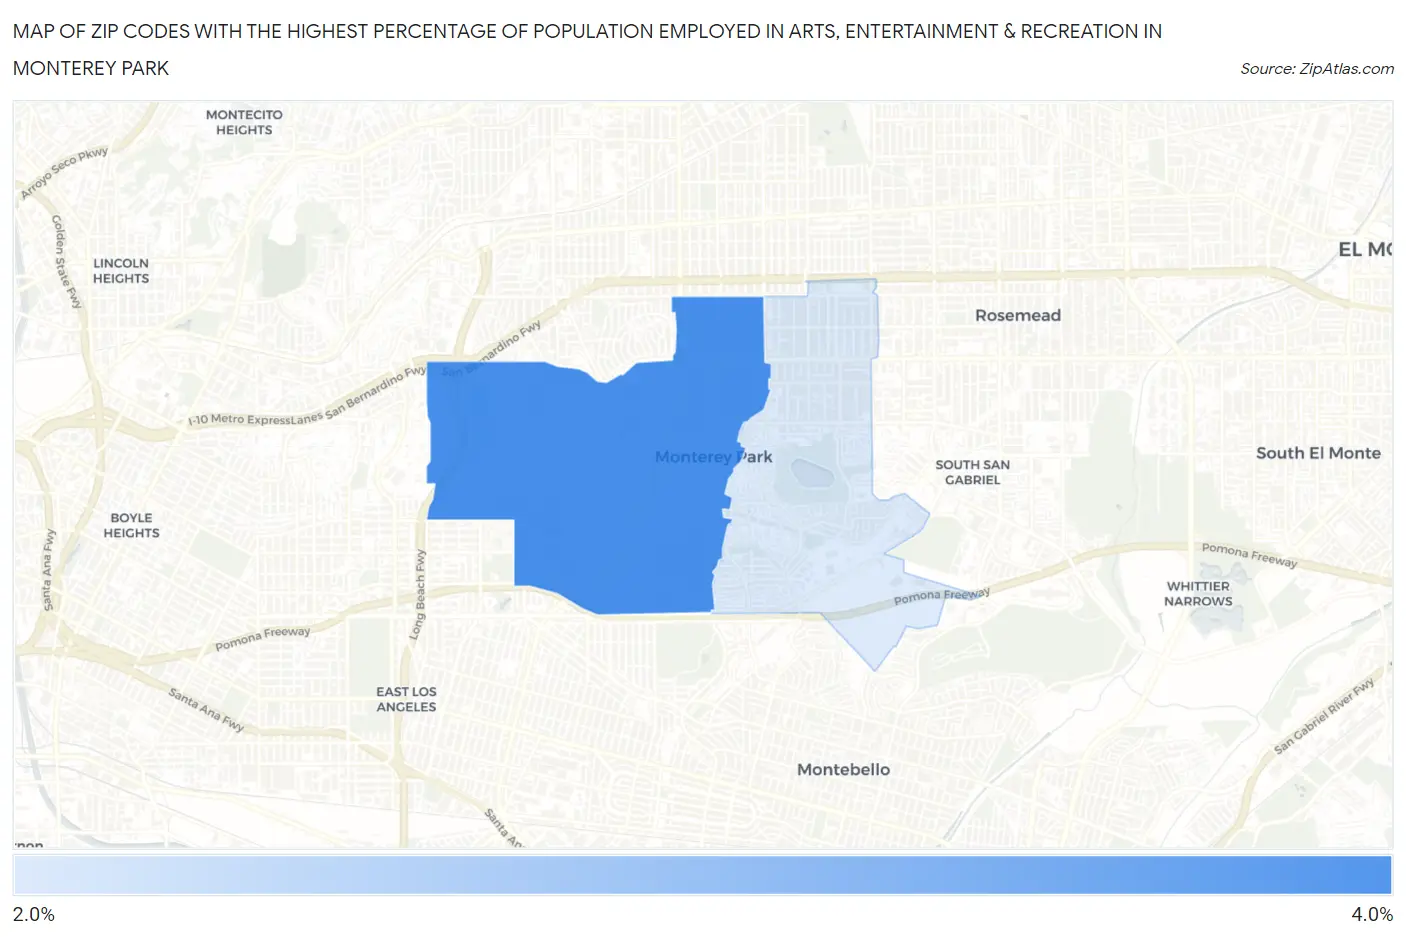
Map of Zip Codes with the Highest Percentage of Population Employed in Arts, Entertainment & Recreation in Monterey Park
0.0%
4.0%
Zip Codes with the Highest Percentage of Population Employed in Arts, Entertainment & Recreation in Monterey Park, CA
| Zip Code | % Employed | vs State | vs National | |
| 1. | 91754 | 3.7% | 2.6%(+1.19)#370 | 2.1%(+1.66)#3,718 |
| 2. | 91755 | 2.0% | 2.6%(-0.524)#908 | 2.1%(-0.053)#9,600 |
1
Common Questions
What are the Top Zip Codes with the Highest Percentage of Population Employed in Arts, Entertainment & Recreation in Monterey Park, CA?
Top Zip Codes with the Highest Percentage of Population Employed in Arts, Entertainment & Recreation in Monterey Park, CA are:
What zip code has the Highest Percentage of Population Employed in Arts, Entertainment & Recreation in Monterey Park, CA?
91754 has the Highest Percentage of Population Employed in Arts, Entertainment & Recreation in Monterey Park, CA with 3.7%.
What is the Percentage of Population Employed in Arts, Entertainment & Recreation in Monterey Park, CA?
Percentage of Population Employed in Arts, Entertainment & Recreation in Monterey Park is 3.0%.
What is the Percentage of Population Employed in Arts, Entertainment & Recreation in California?
Percentage of Population Employed in Arts, Entertainment & Recreation in California is 2.6%.
What is the Percentage of Population Employed in Arts, Entertainment & Recreation in the United States?
Percentage of Population Employed in Arts, Entertainment & Recreation in the United States is 2.1%.