Zip Codes with the Highest Percentage of Population Employed in Real Estate, Rental & Leasing in Monterey Park, CA
RELATED REPORTS & OPTIONS
Real Estate, Rental & Leasing
Monterey Park
Compare Zip Codes
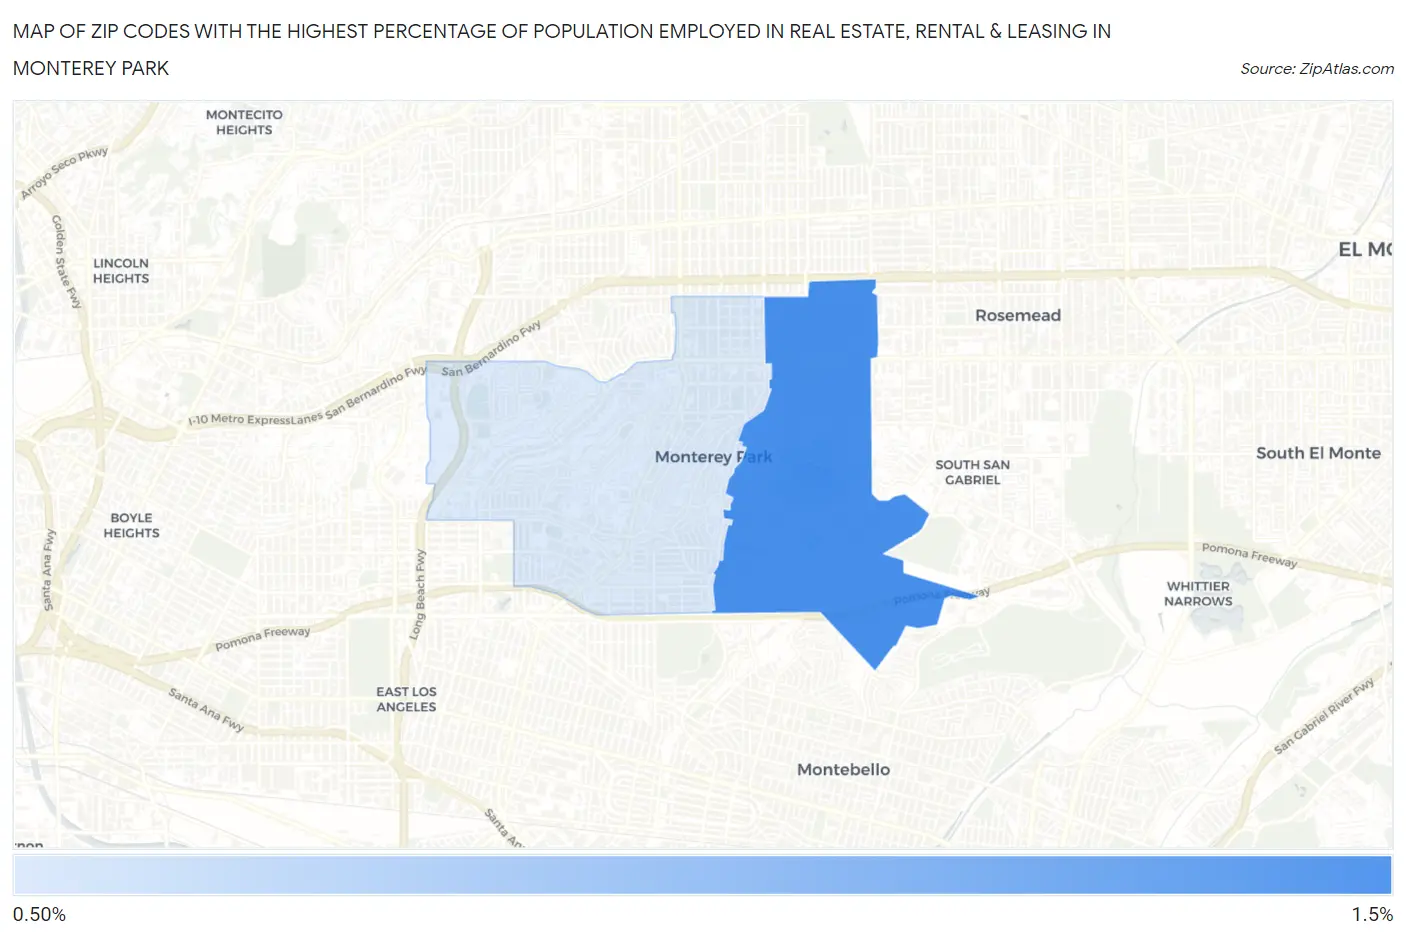
Map of Zip Codes with the Highest Percentage of Population Employed in Real Estate, Rental & Leasing in Monterey Park
0.0%
1.5%
Zip Codes with the Highest Percentage of Population Employed in Real Estate, Rental & Leasing in Monterey Park, CA
| Zip Code | % Employed | vs State | vs National | |
| 1. | 91755 | 1.4% | 2.1%(-0.718)#989 | 1.9%(-0.490)#11,965 |
| 2. | 91754 | 1.4% | 2.1%(-0.728)#993 | 1.9%(-0.501)#12,051 |
1
Common Questions
What are the Top Zip Codes with the Highest Percentage of Population Employed in Real Estate, Rental & Leasing in Monterey Park, CA?
Top Zip Codes with the Highest Percentage of Population Employed in Real Estate, Rental & Leasing in Monterey Park, CA are:
What zip code has the Highest Percentage of Population Employed in Real Estate, Rental & Leasing in Monterey Park, CA?
91755 has the Highest Percentage of Population Employed in Real Estate, Rental & Leasing in Monterey Park, CA with 1.4%.
What is the Percentage of Population Employed in Real Estate, Rental & Leasing in Monterey Park, CA?
Percentage of Population Employed in Real Estate, Rental & Leasing in Monterey Park is 1.4%.
What is the Percentage of Population Employed in Real Estate, Rental & Leasing in California?
Percentage of Population Employed in Real Estate, Rental & Leasing in California is 2.1%.
What is the Percentage of Population Employed in Real Estate, Rental & Leasing in the United States?
Percentage of Population Employed in Real Estate, Rental & Leasing in the United States is 1.9%.