Zip Codes with the Highest Percentage of Population Employed in Office & Administration in Monterey Park, CA
RELATED REPORTS & OPTIONS
Office & Administration
Monterey Park
Compare Zip Codes
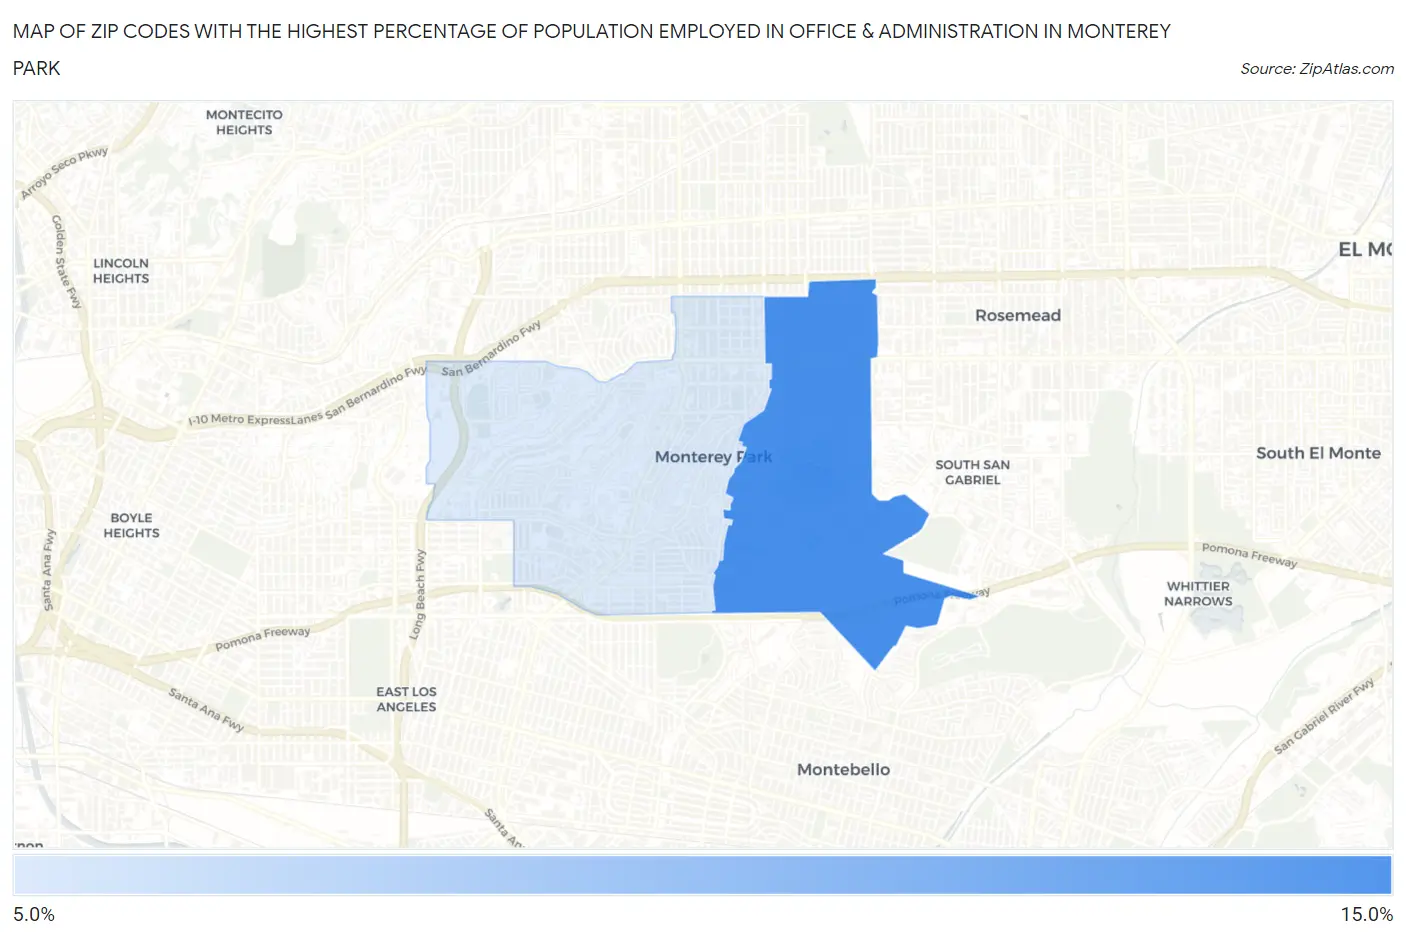
Map of Zip Codes with the Highest Percentage of Population Employed in Office & Administration in Monterey Park
0.0%
15.0%
Zip Codes with the Highest Percentage of Population Employed in Office & Administration in Monterey Park, CA
| Zip Code | % Employed | vs State | vs National | |
| 1. | 91755 | 12.0% | 10.5%(+1.52)#456 | 10.9%(+1.17)#10,634 |
| 2. | 91754 | 10.6% | 10.5%(+0.116)#738 | 10.9%(-0.237)#15,056 |
1
Common Questions
What are the Top Zip Codes with the Highest Percentage of Population Employed in Office & Administration in Monterey Park, CA?
Top Zip Codes with the Highest Percentage of Population Employed in Office & Administration in Monterey Park, CA are:
What zip code has the Highest Percentage of Population Employed in Office & Administration in Monterey Park, CA?
91755 has the Highest Percentage of Population Employed in Office & Administration in Monterey Park, CA with 12.0%.
What is the Percentage of Population Employed in Office & Administration in Monterey Park, CA?
Percentage of Population Employed in Office & Administration in Monterey Park is 11.2%.
What is the Percentage of Population Employed in Office & Administration in California?
Percentage of Population Employed in Office & Administration in California is 10.5%.
What is the Percentage of Population Employed in Office & Administration in the United States?
Percentage of Population Employed in Office & Administration in the United States is 10.9%.