Zip Codes with the Highest Percentage of Population with a Degree in Science and Engineering in San Gabriel, CA
RELATED REPORTS & OPTIONS
Science and Engineering
San Gabriel
Compare Zip Codes
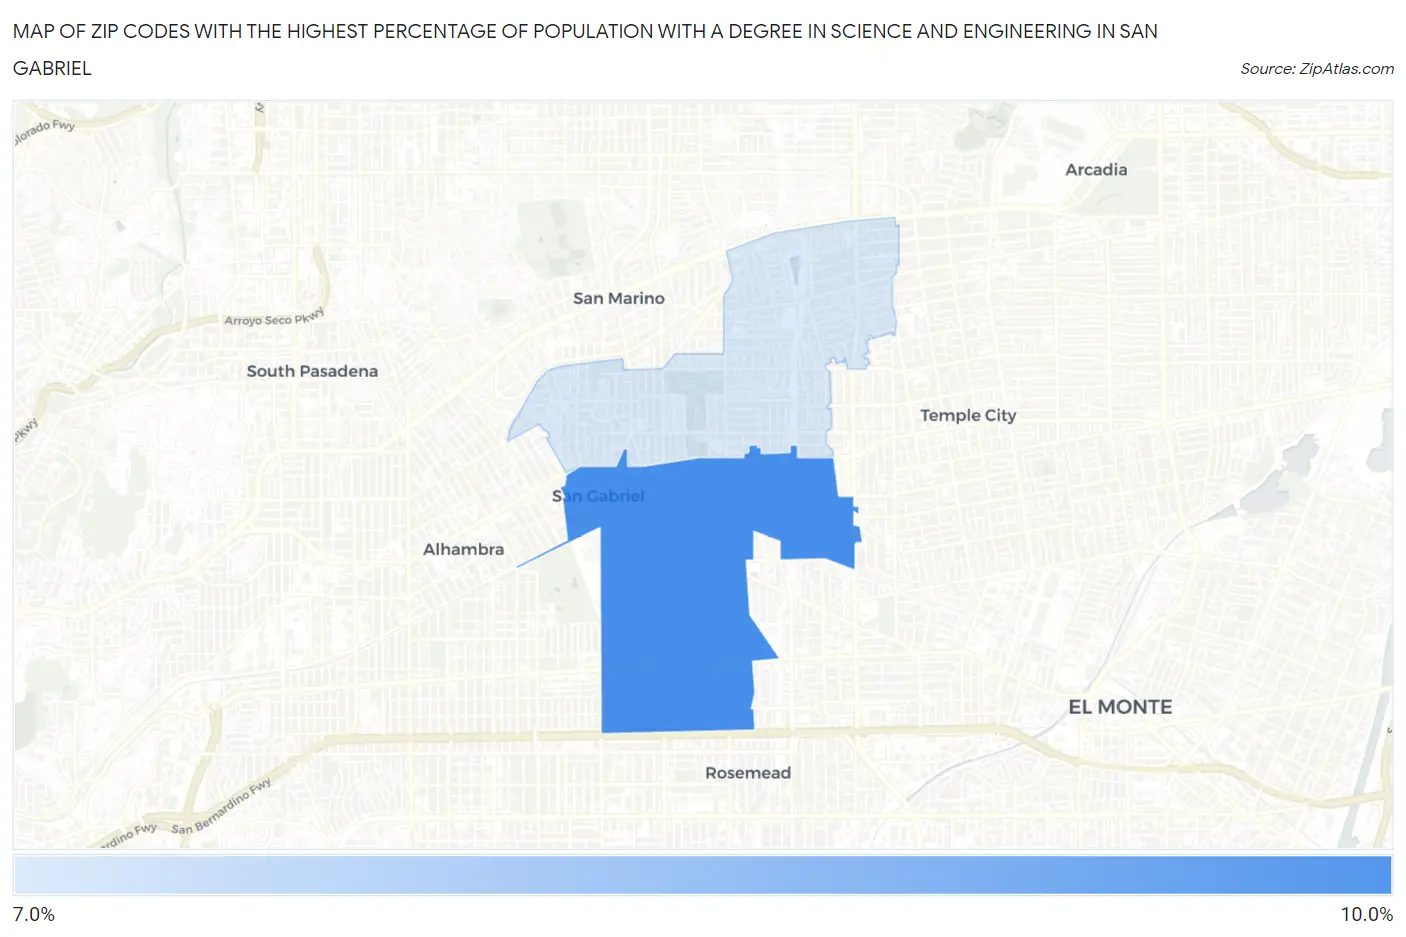
Map of Zip Codes with the Highest Percentage of Population with a Degree in Science and Engineering in San Gabriel
0.0%
10.0%
Zip Codes with the Highest Percentage of Population with a Degree in Science and Engineering in San Gabriel, CA
| Zip Code | % Graduates | vs State | vs National | |
| 1. | 91776 | 8.4% | 8.3%(+0.163)#711 | 9.8%(-1.36)#18,641 |
| 2. | 91775 | 7.5% | 8.3%(-0.737)#881 | 9.8%(-2.26)#20,668 |
1
Common Questions
What are the Top Zip Codes with the Highest Percentage of Population with a Degree in Science and Engineering in San Gabriel, CA?
Top Zip Codes with the Highest Percentage of Population with a Degree in Science and Engineering in San Gabriel, CA are:
What zip code has the Highest Percentage of Population with a Degree in Science and Engineering in San Gabriel, CA?
91776 has the Highest Percentage of Population with a Degree in Science and Engineering in San Gabriel, CA with 8.4%.
What is the Percentage of Population with a Degree in Science and Engineering in San Gabriel, CA?
Percentage of Population with a Degree in Science and Engineering in San Gabriel is 7.6%.
What is the Percentage of Population with a Degree in Science and Engineering in California?
Percentage of Population with a Degree in Science and Engineering in California is 8.3%.
What is the Percentage of Population with a Degree in Science and Engineering in the United States?
Percentage of Population with a Degree in Science and Engineering in the United States is 9.8%.