Zip Codes with the Highest Percentage of Population Employed in Office & Administration in Grass Valley, CA
RELATED REPORTS & OPTIONS
Office & Administration
Grass Valley
Compare Zip Codes
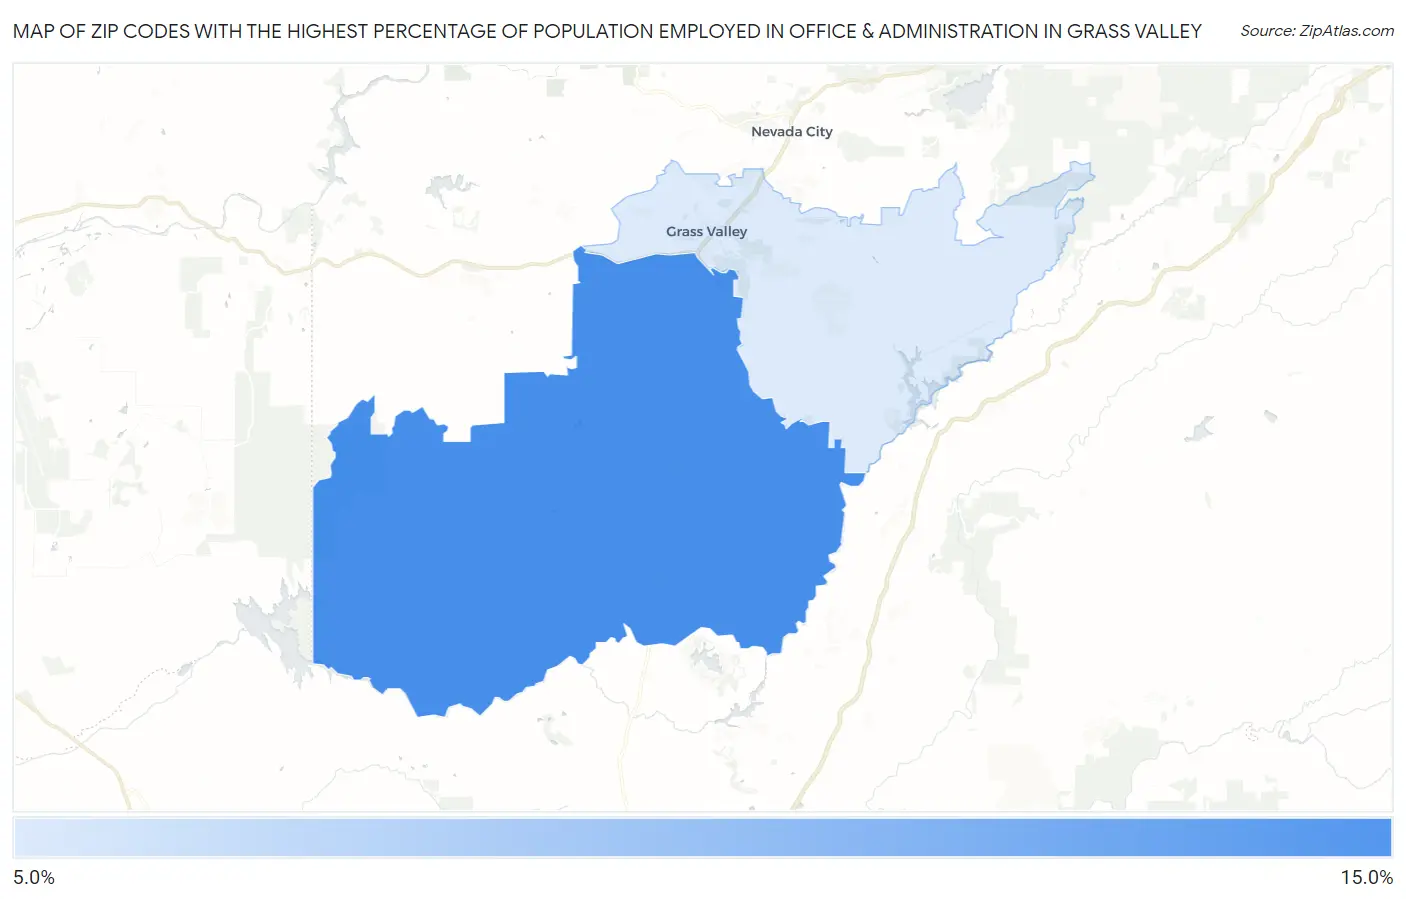
Map of Zip Codes with the Highest Percentage of Population Employed in Office & Administration in Grass Valley
0.0%
15.0%
Zip Codes with the Highest Percentage of Population Employed in Office & Administration in Grass Valley, CA
| Zip Code | % Employed | vs State | vs National | |
| 1. | 95949 | 12.7% | 10.5%(+2.17)#364 | 10.9%(+1.81)#8,872 |
| 2. | 95945 | 9.4% | 10.5%(-1.11)#959 | 10.9%(-1.46)#19,098 |
1
Common Questions
What are the Top Zip Codes with the Highest Percentage of Population Employed in Office & Administration in Grass Valley, CA?
Top Zip Codes with the Highest Percentage of Population Employed in Office & Administration in Grass Valley, CA are:
What zip code has the Highest Percentage of Population Employed in Office & Administration in Grass Valley, CA?
95949 has the Highest Percentage of Population Employed in Office & Administration in Grass Valley, CA with 12.7%.
What is the Percentage of Population Employed in Office & Administration in Grass Valley, CA?
Percentage of Population Employed in Office & Administration in Grass Valley is 11.0%.
What is the Percentage of Population Employed in Office & Administration in California?
Percentage of Population Employed in Office & Administration in California is 10.5%.
What is the Percentage of Population Employed in Office & Administration in the United States?
Percentage of Population Employed in Office & Administration in the United States is 10.9%.