Zip Codes with the Highest Percentage of Population Employed in Firefighting & Prevention in Phoenix, AZ
RELATED REPORTS & OPTIONS
Firefighting & Prevention
Phoenix
Compare Zip Codes
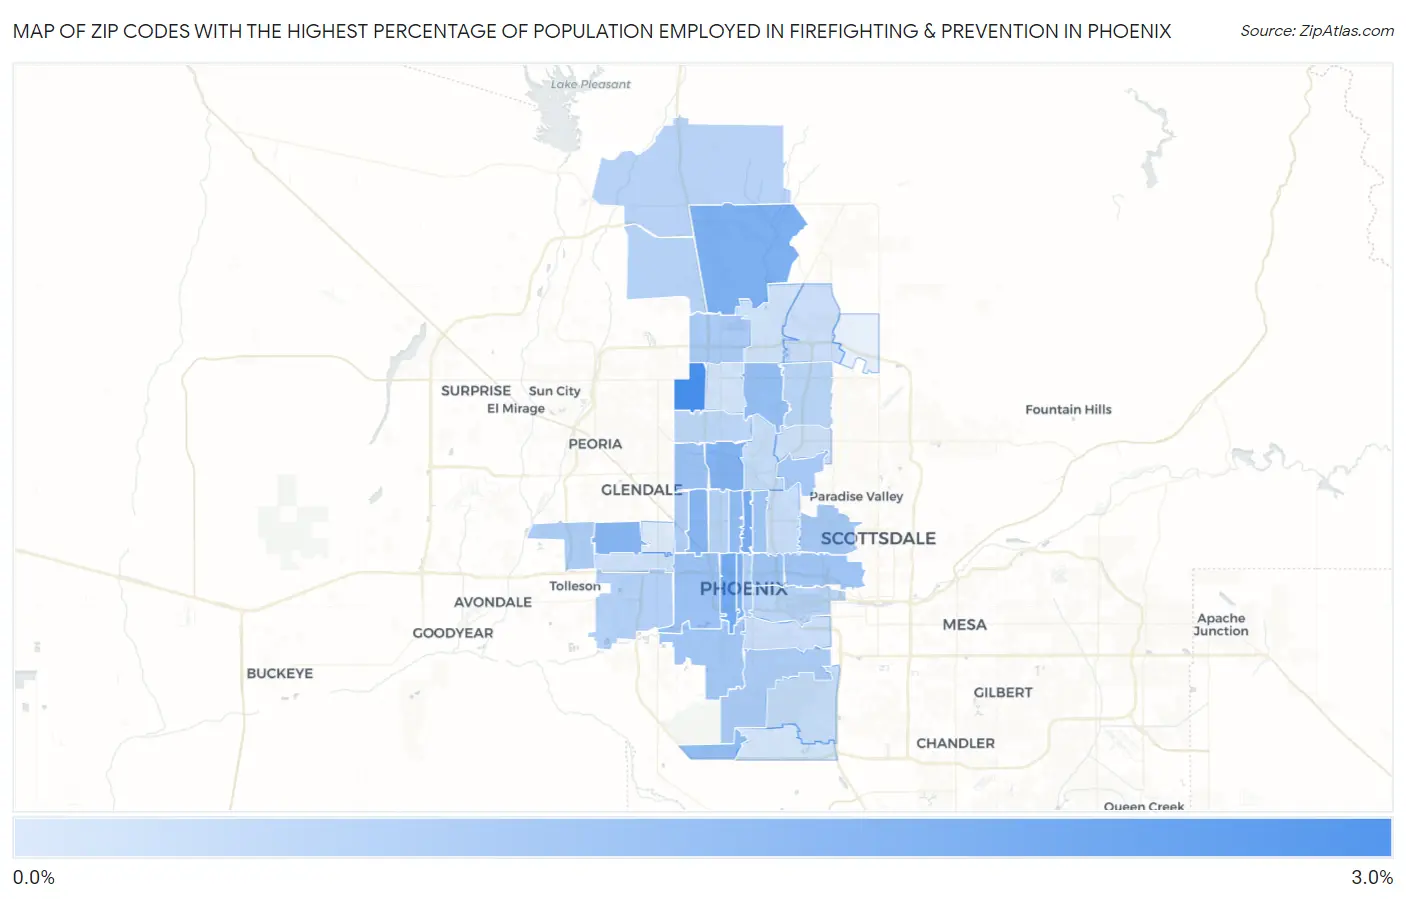
Map of Zip Codes with the Highest Percentage of Population Employed in Firefighting & Prevention in Phoenix
0.0%
3.0%
Zip Codes with the Highest Percentage of Population Employed in Firefighting & Prevention in Phoenix, AZ
| Zip Code | % Employed | vs State | vs National | |
| 1. | 85053 | 2.9% | 1.4%(+1.58)#56 | 1.2%(+1.75)#2,329 |
| 2. | 85007 | 2.1% | 1.4%(+0.779)#87 | 1.2%(+0.951)#4,042 |
| 3. | 85012 | 2.1% | 1.4%(+0.727)#90 | 1.2%(+0.898)#4,202 |
| 4. | 85085 | 2.0% | 1.4%(+0.666)#95 | 1.2%(+0.837)#4,429 |
| 5. | 85003 | 1.9% | 1.4%(+0.564)#106 | 1.2%(+0.736)#4,826 |
| 6. | 85021 | 1.9% | 1.4%(+0.555)#107 | 1.2%(+0.726)#4,872 |
| 7. | 85033 | 1.8% | 1.4%(+0.465)#110 | 1.2%(+0.636)#5,254 |
| 8. | 85017 | 1.8% | 1.4%(+0.459)#111 | 1.2%(+0.630)#5,276 |
| 9. | 85013 | 1.7% | 1.4%(+0.293)#128 | 1.2%(+0.465)#6,095 |
| 10. | 85045 | 1.6% | 1.4%(+0.264)#134 | 1.2%(+0.435)#6,273 |
| 11. | 85022 | 1.6% | 1.4%(+0.234)#141 | 1.2%(+0.406)#6,430 |
| 12. | 85009 | 1.5% | 1.4%(+0.128)#149 | 1.2%(+0.299)#7,082 |
| 13. | 85051 | 1.5% | 1.4%(+0.115)#150 | 1.2%(+0.287)#7,154 |
| 14. | 85006 | 1.4% | 1.4%(+0.079)#153 | 1.2%(+0.250)#7,396 |
| 15. | 85008 | 1.4% | 1.4%(+0.054)#156 | 1.2%(+0.225)#7,567 |
| 16. | 85041 | 1.4% | 1.4%(+0.000)#165 | 1.2%(+0.172)#7,923 |
| 17. | 85014 | 1.3% | 1.4%(-0.018)#172 | 1.2%(+0.154)#8,058 |
| 18. | 85018 | 1.3% | 1.4%(-0.056)#177 | 1.2%(+0.115)#8,343 |
| 19. | 85027 | 1.2% | 1.4%(-0.132)#193 | 1.2%(+0.039)#8,942 |
| 20. | 85042 | 1.2% | 1.4%(-0.166)#195 | 1.2%(+0.006)#9,209 |
| 21. | 85037 | 1.2% | 1.4%(-0.170)#196 | 1.2%(+0.001)#9,257 |
| 22. | 85019 | 1.2% | 1.4%(-0.206)#199 | 1.2%(-0.034)#9,604 |
| 23. | 85004 | 1.1% | 1.4%(-0.234)#205 | 1.2%(-0.063)#9,886 |
| 24. | 85043 | 1.1% | 1.4%(-0.261)#207 | 1.2%(-0.090)#10,139 |
| 25. | 85083 | 1.1% | 1.4%(-0.305)#214 | 1.2%(-0.134)#10,579 |
| 26. | 85015 | 1.0% | 1.4%(-0.321)#216 | 1.2%(-0.149)#10,716 |
| 27. | 85086 | 1.0% | 1.4%(-0.333)#217 | 1.2%(-0.162)#10,835 |
| 28. | 85034 | 0.98% | 1.4%(-0.374)#227 | 1.2%(-0.202)#11,260 |
| 29. | 85032 | 0.96% | 1.4%(-0.396)#231 | 1.2%(-0.225)#11,524 |
| 30. | 85029 | 0.93% | 1.4%(-0.428)#239 | 1.2%(-0.256)#11,842 |
| 31. | 85020 | 0.78% | 1.4%(-0.577)#257 | 1.2%(-0.405)#13,432 |
| 32. | 85044 | 0.78% | 1.4%(-0.579)#258 | 1.2%(-0.407)#13,449 |
| 33. | 85016 | 0.73% | 1.4%(-0.630)#265 | 1.2%(-0.459)#14,023 |
| 34. | 85050 | 0.69% | 1.4%(-0.665)#269 | 1.2%(-0.493)#14,416 |
| 35. | 85040 | 0.69% | 1.4%(-0.666)#270 | 1.2%(-0.495)#14,439 |
| 36. | 85028 | 0.67% | 1.4%(-0.692)#273 | 1.2%(-0.520)#14,724 |
| 37. | 85035 | 0.65% | 1.4%(-0.709)#276 | 1.2%(-0.537)#14,909 |
| 38. | 85024 | 0.62% | 1.4%(-0.733)#278 | 1.2%(-0.561)#15,156 |
| 39. | 85023 | 0.57% | 1.4%(-0.788)#285 | 1.2%(-0.617)#15,748 |
| 40. | 85048 | 0.53% | 1.4%(-0.832)#289 | 1.2%(-0.660)#16,253 |
| 41. | 85031 | 0.38% | 1.4%(-0.973)#299 | 1.2%(-0.802)#17,834 |
1
Common Questions
What are the Top 10 Zip Codes with the Highest Percentage of Population Employed in Firefighting & Prevention in Phoenix, AZ?
Top 10 Zip Codes with the Highest Percentage of Population Employed in Firefighting & Prevention in Phoenix, AZ are:
What zip code has the Highest Percentage of Population Employed in Firefighting & Prevention in Phoenix, AZ?
85053 has the Highest Percentage of Population Employed in Firefighting & Prevention in Phoenix, AZ with 2.9%.
What is the Percentage of Population Employed in Firefighting & Prevention in Phoenix, AZ?
Percentage of Population Employed in Firefighting & Prevention in Phoenix is 1.2%.
What is the Percentage of Population Employed in Firefighting & Prevention in Arizona?
Percentage of Population Employed in Firefighting & Prevention in Arizona is 1.4%.
What is the Percentage of Population Employed in Firefighting & Prevention in the United States?
Percentage of Population Employed in Firefighting & Prevention in the United States is 1.2%.