Zip Codes with the Highest Percentage of Population Employed in Life, Physical & Social Science in Phoenix, AZ

RELATED REPORTS & OPTIONS

Life, Physical & Social Science
Population
Families and Households
Female Fertility
Female Fertility (Unmarried)
Race (Community Size)
Race (Percentage)
Ancestry (Community Size)
AfghanAfricanAlaska NativeAlaskan AthabascanAlbanianAmericanApacheArabArgentineanArmenianAssyrian / Chaldean / SyriacAustralianAustrianBahamianBangladeshiBarbadianBasqueBelgianBelizeanBhutaneseBlackfeetBolivianBrazilianBritishBritish West IndianBulgarianBurmeseCajunCanadianCape VerdeanCarpatho RusynCelticCentral AmericanCentral American IndianCherokeeCheyenneChickasawChileanChippewaChoctawColombianColvilleComancheCosta RicanCreeCreekCroatianCubanCypriotCzechCzechoslovakianDanishDelawareDominicanDutchEastern EuropeanEcuadorianEgyptianEnglishEstonianEthiopianEuropeanFijianFilipinoFinnishFrenchFrench American IndianFrench CanadianGermanGerman RussianGhanaianGreekGuamanian / ChamorroGuatemalanGuyaneseHaitianHonduranHopiHungarianIcelanderIndian (Asian)IndonesianInupiatIranianIraqiIrishIroquoisIsraeliItalianJamaicanJapaneseJordanianKenyanKiowaKoreanLaotianLatvianLebaneseLiberianLithuanianLuxembourgerMacedonianMalaysianMalteseMexicanMexican American IndianMongolianMoroccanNative HawaiianNavajoNew ZealanderNicaraguanNigerianNorthern EuropeanNorwegianOsagePaiutePakistaniPalestinianPanamanianParaguayanPennsylvania GermanPeruvianPimaPolishPortuguesePotawatomiPuebloPuerto RicanPuget Sound SalishRomanianRussianSalvadoranSamoanScandinavianScotch-IrishScottishSeminoleSenegaleseSerbianShoshoneSierra LeoneanSiouxSlavicSlovakSloveneSomaliSouth AfricanSouth AmericanSouth American IndianSoviet UnionSpaniardSpanishSpanish AmericanSpanish American IndianSri LankanSubsaharan AfricanSudaneseSwedishSwissSyrianThaiTlingit-HaidaTohono O'OdhamTonganTrinidadian and TobagonianTurkishUgandanUkrainianUruguayanUteVenezuelanVietnameseWelshWest IndianYakamaYaquiYugoslavianYumanZimbabwean
Ancestry (Percentage)
AfghanAfricanAlaska NativeAlaskan AthabascanAlbanianAmericanApacheArabArgentineanArmenianAssyrian / Chaldean / SyriacAustralianAustrianBahamianBangladeshiBarbadianBasqueBelgianBelizeanBhutaneseBlackfeetBolivianBrazilianBritishBritish West IndianBulgarianBurmeseCajunCanadianCape VerdeanCarpatho RusynCelticCentral AmericanCentral American IndianCherokeeCheyenneChickasawChileanChippewaChoctawColombianColvilleComancheCosta RicanCreeCreekCroatianCubanCypriotCzechCzechoslovakianDanishDelawareDominicanDutchEastern EuropeanEcuadorianEgyptianEnglishEstonianEthiopianEuropeanFijianFilipinoFinnishFrenchFrench American IndianFrench CanadianGermanGerman RussianGhanaianGreekGuamanian / ChamorroGuatemalanGuyaneseHaitianHonduranHopiHungarianIcelanderIndian (Asian)IndonesianInupiatIranianIraqiIrishIroquoisIsraeliItalianJamaicanJapaneseJordanianKenyanKiowaKoreanLaotianLatvianLebaneseLiberianLithuanianLuxembourgerMacedonianMalaysianMalteseMexicanMexican American IndianMongolianMoroccanNative HawaiianNavajoNew ZealanderNicaraguanNigerianNorthern EuropeanNorwegianOsagePaiutePakistaniPalestinianPanamanianParaguayanPennsylvania GermanPeruvianPimaPolishPortuguesePotawatomiPuebloPuerto RicanPuget Sound SalishRomanianRussianSalvadoranSamoanScandinavianScotch-IrishScottishSeminoleSenegaleseSerbianShoshoneSierra LeoneanSiouxSlavicSlovakSloveneSomaliSouth AfricanSouth AmericanSouth American IndianSoviet UnionSpaniardSpanishSpanish AmericanSpanish American IndianSri LankanSubsaharan AfricanSudaneseSwedishSwissSyrianThaiTlingit-HaidaTohono O'OdhamTonganTrinidadian and TobagonianTurkishUgandanUkrainianUruguayanUteVenezuelanVietnameseWelshWest IndianYakamaYaquiYugoslavianYumanZimbabwean
Immigrant Origin (Total)
AfghanistanAfricaAlbaniaArgentinaArmeniaAsiaAustraliaAustriaBahamasBangladeshBarbadosBelarusBelgiumBelizeBoliviaBosnia and HerzegovinaBrazilBulgariaBurma / MyanmarCambodiaCameroonCanadaCaribbeanCentral AmericaChileChinaColombiaCongoCosta RicaCroatiaCubaCzechoslovakiaDenmarkDominicaDominican RepublicEastern AfricaEastern AsiaEastern EuropeEcuadorEgyptEl SalvadorEnglandEritreaEthiopiaEuropeFranceGermanyGhanaGreeceGuatemalaGuyanaHaitiHondurasHong KongHungaryIndiaIndonesiaIranIraqIrelandIsraelItalyJamaicaJapanJordanKazakhstanKenyaKoreaKuwaitLaosLatin AmericaLebanonLiberiaLithuaniaMalaysiaMexicoMicronesiaMiddle AfricaMoldovaMoroccoNepalNetherlandsNicaraguaNigeriaNorthern AfricaNorthern EuropeNorwayOceaniaPakistanPanamaPeruPhilippinesPolandPortugalRomaniaRussiaSaudi ArabiaScotlandSerbiaSierra LeoneSingaporeSomaliaSouth AfricaSouth AmericaSouth Central AsiaSouth Eastern AsiaSouthern EuropeSpainSri LankaSudanSwedenSwitzerlandSyriaTaiwanThailandTrinidad and TobagoTurkeyUgandaUkraineUruguayUzbekistanVenezuelaVietnamWestern AfricaWestern AsiaWestern EuropeZaireZimbabwe
Immigrant Origin (Percentage)
AfghanistanAfricaAlbaniaArgentinaArmeniaAsiaAustraliaAustriaBahamasBangladeshBarbadosBelarusBelgiumBelizeBoliviaBosnia and HerzegovinaBrazilBulgariaBurma / MyanmarCambodiaCameroonCanadaCaribbeanCentral AmericaChileChinaColombiaCongoCosta RicaCroatiaCubaCzechoslovakiaDenmarkDominicaDominican RepublicEastern AfricaEastern AsiaEastern EuropeEcuadorEgyptEl SalvadorEnglandEritreaEthiopiaEuropeFranceGermanyGhanaGreeceGuatemalaGuyanaHaitiHondurasHong KongHungaryIndiaIndonesiaIranIraqIrelandIsraelItalyJamaicaJapanJordanKazakhstanKenyaKoreaKuwaitLaosLatin AmericaLebanonLiberiaLithuaniaMalaysiaMexicoMicronesiaMiddle AfricaMoldovaMoroccoNepalNetherlandsNicaraguaNigeriaNorthern AfricaNorthern EuropeNorwayOceaniaPakistanPanamaPeruPhilippinesPolandPortugalRomaniaRussiaSaudi ArabiaScotlandSerbiaSierra LeoneSingaporeSomaliaSouth AfricaSouth AmericaSouth Central AsiaSouth Eastern AsiaSouthern EuropeSpainSri LankaSudanSwedenSwitzerlandSyriaTaiwanThailandTrinidad and TobagoTurkeyUgandaUkraineUruguayUzbekistanVenezuelaVietnamWestern AfricaWestern AsiaWestern EuropeZaireZimbabwe
Income
Income (Families)
Income (Households)
Poverty
Poverty (Families)
Unemployment
Employment Occupations
Employment Industries
Employer Class
Commute Time
Commute Means
School Enrollment
Education by Degree Field
Occupancy
Finances
Physical Characteristics
Phoenix
Compare Zip Codes
Comparison Subject

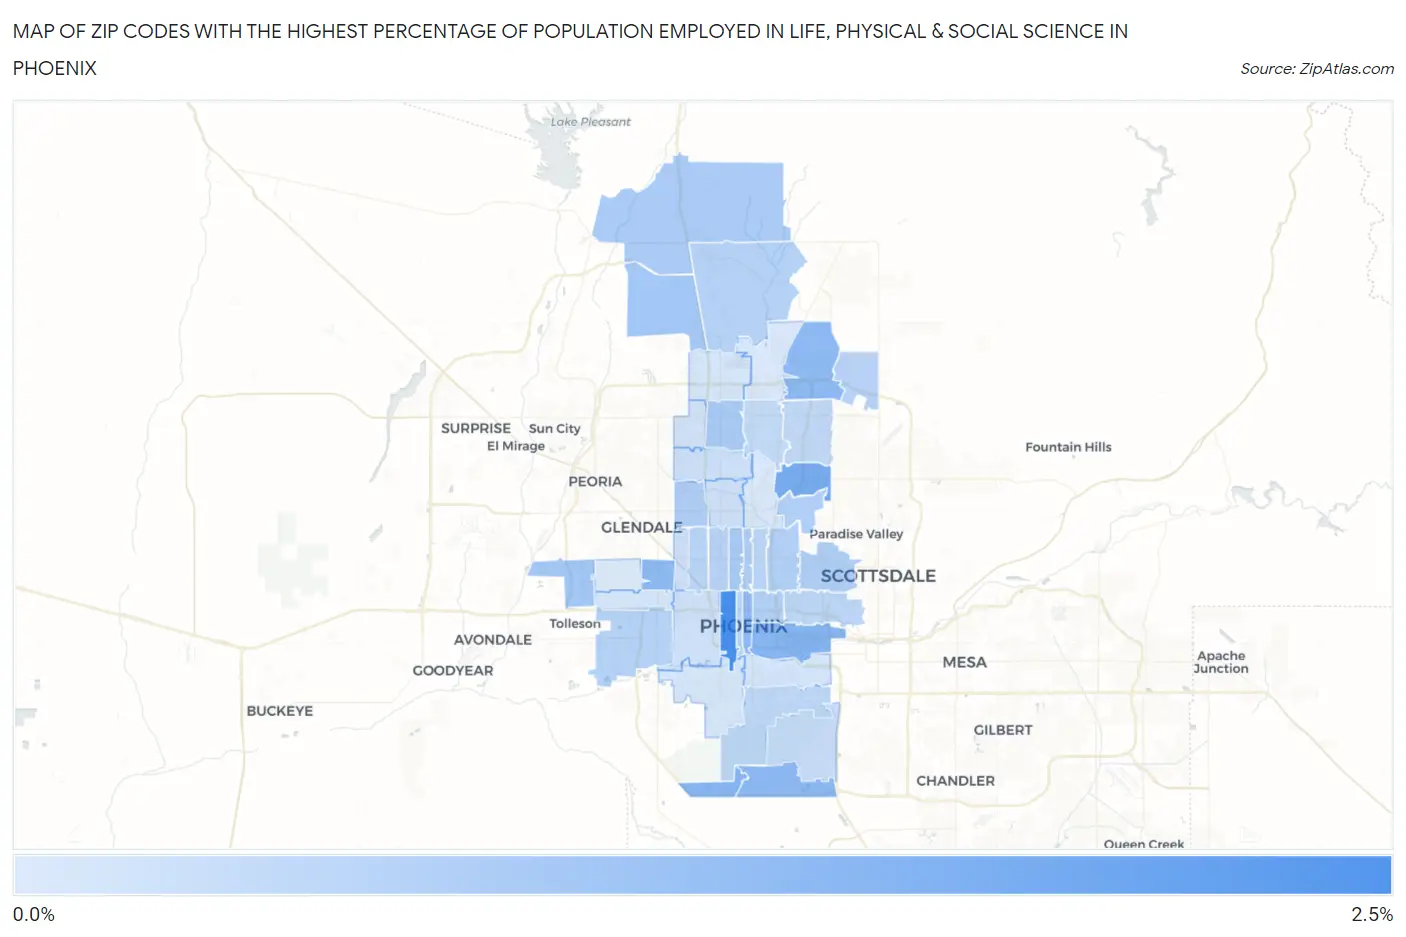
Map of Zip Codes with the Highest Percentage of Population Employed in Life, Physical & Social Science in Phoenix

0.0%
2.5%
Zip Codes with the Highest Percentage of Population Employed in Life, Physical & Social Science in Phoenix Map

Zip Codes with the Highest Percentage of Population Employed in Life, Physical & Social Science in Phoenix, AZ

Zip Code % Employed vs State vs National
1.850072.5%0.83%(+1.65)#281.1%(+1.39)#2,602
2.850281.7%0.83%(+0.882)#501.1%(+0.624)#4,656
3.850451.5%0.83%(+0.643)#601.1%(+0.385)#5,791
4.850341.5%0.83%(+0.623)#631.1%(+0.365)#5,892
5.850481.4%0.83%(+0.546)#681.1%(+0.287)#6,317
6.850311.3%0.83%(+0.515)#721.1%(+0.256)#6,483
7.850501.3%0.83%(+0.512)#731.1%(+0.253)#6,501
8.850041.3%0.83%(+0.502)#761.1%(+0.244)#6,564
9.850831.0%0.83%(+0.200)#1061.1%(-0.059)#8,783
10.850371.0%0.83%(+0.197)#1071.1%(-0.062)#8,805
11.850230.96%0.83%(+0.126)#1141.1%(-0.133)#9,424
12.850130.95%0.83%(+0.121)#1151.1%(-0.137)#9,468
13.850860.91%0.83%(+0.076)#1211.1%(-0.183)#9,884
14.850120.89%0.83%(+0.058)#1261.1%(-0.201)#10,054
15.850510.84%0.83%(+0.005)#1341.1%(-0.253)#10,597
16.850180.82%0.83%(-0.011)#1361.1%(-0.269)#10,785
17.850060.79%0.83%(-0.046)#1391.1%(-0.304)#11,129
18.850160.76%0.83%(-0.071)#1451.1%(-0.329)#11,381
19.850850.73%0.83%(-0.101)#1481.1%(-0.359)#11,689
20.850430.73%0.83%(-0.104)#1491.1%(-0.362)#11,730
21.850030.72%0.83%(-0.115)#1521.1%(-0.373)#11,836
22.850540.69%0.83%(-0.139)#1561.1%(-0.397)#12,110
23.850150.69%0.83%(-0.145)#1571.1%(-0.403)#12,186
24.850170.68%0.83%(-0.157)#1591.1%(-0.416)#12,348
25.850080.63%0.83%(-0.206)#1671.1%(-0.464)#12,949
26.850140.62%0.83%(-0.209)#1681.1%(-0.468)#13,001
27.850420.59%0.83%(-0.247)#1741.1%(-0.506)#13,479
28.850320.55%0.83%(-0.280)#1771.1%(-0.539)#13,875
29.850220.51%0.83%(-0.319)#1831.1%(-0.578)#14,343
30.850440.46%0.83%(-0.375)#1961.1%(-0.633)#15,040
31.850290.37%0.83%(-0.465)#2111.1%(-0.723)#16,169
32.850190.36%0.83%(-0.473)#2131.1%(-0.732)#16,293
33.850090.35%0.83%(-0.478)#2151.1%(-0.736)#16,353
34.850210.33%0.83%(-0.502)#2231.1%(-0.760)#16,660
35.850530.30%0.83%(-0.535)#2291.1%(-0.793)#17,090
36.850400.28%0.83%(-0.552)#2311.1%(-0.811)#17,282
37.850350.25%0.83%(-0.581)#2351.1%(-0.840)#17,620
38.850270.25%0.83%(-0.582)#2361.1%(-0.840)#17,628
39.850410.23%0.83%(-0.598)#2381.1%(-0.856)#17,810
40.850200.15%0.83%(-0.681)#2481.1%(-0.939)#18,666
41.850240.15%0.83%(-0.684)#2491.1%(-0.942)#18,693
42.850330.13%0.83%(-0.707)#2531.1%(-0.965)#18,893

Common Questions

What are the Top 10 Zip Codes with the Highest Percentage of Population Employed in Life, Physical & Social Science in Phoenix, AZ?
Top 10 Zip Codes with the Highest Percentage of Population Employed in Life, Physical & Social Science in Phoenix, AZ are:
#1
2.5%
#2
1.7%
#3
1.5%
#4
1.5%
#5
1.4%
#6
1.3%
#7
1.3%
#8
1.3%
#9
1.0%
#10
1.0%
What zip code has the Highest Percentage of Population Employed in Life, Physical & Social Science in Phoenix, AZ?
85007 has the Highest Percentage of Population Employed in Life, Physical & Social Science in Phoenix, AZ with 2.5%.
What is the Percentage of Population Employed in Life, Physical & Social Science in Phoenix, AZ?
Percentage of Population Employed in Life, Physical & Social Science in Phoenix is 0.66%.
What is the Percentage of Population Employed in Life, Physical & Social Science in Arizona?
Percentage of Population Employed in Life, Physical & Social Science in Arizona is 0.83%.
What is the Percentage of Population Employed in Life, Physical & Social Science in the United States?
Percentage of Population Employed in Life, Physical & Social Science in the United States is 1.1%.