Zip Codes with the Highest Percentage of Population Employed in Accommodation & Food Services in Apache Junction, AZ
RELATED REPORTS & OPTIONS
Accommodation & Food Services
Apache Junction
Compare Zip Codes
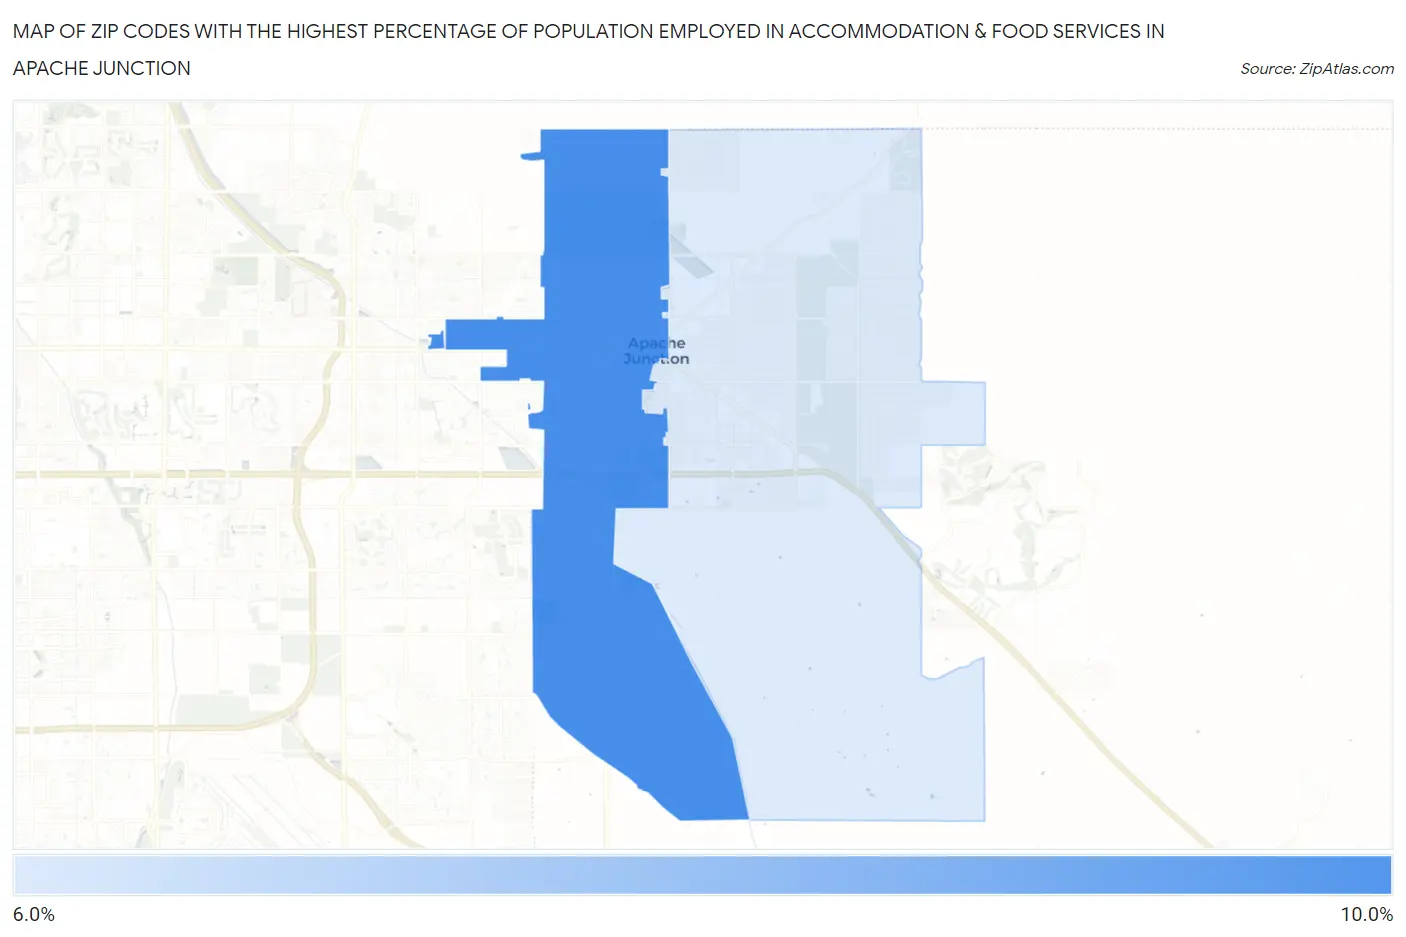
Map of Zip Codes with the Highest Percentage of Population Employed in Accommodation & Food Services in Apache Junction
0.0%
10.0%
Zip Codes with the Highest Percentage of Population Employed in Accommodation & Food Services in Apache Junction, AZ
| Zip Code | % Employed | vs State | vs National | |
| 1. | 85120 | 8.7% | 7.6%(+1.13)#138 | 6.9%(+1.81)#6,496 |
| 2. | 85119 | 6.1% | 7.6%(-1.41)#229 | 6.9%(-0.737)#12,985 |
1
Common Questions
What are the Top Zip Codes with the Highest Percentage of Population Employed in Accommodation & Food Services in Apache Junction, AZ?
Top Zip Codes with the Highest Percentage of Population Employed in Accommodation & Food Services in Apache Junction, AZ are:
What zip code has the Highest Percentage of Population Employed in Accommodation & Food Services in Apache Junction, AZ?
85120 has the Highest Percentage of Population Employed in Accommodation & Food Services in Apache Junction, AZ with 8.7%.
What is the Percentage of Population Employed in Accommodation & Food Services in Apache Junction, AZ?
Percentage of Population Employed in Accommodation & Food Services in Apache Junction is 7.0%.
What is the Percentage of Population Employed in Accommodation & Food Services in Arizona?
Percentage of Population Employed in Accommodation & Food Services in Arizona is 7.6%.
What is the Percentage of Population Employed in Accommodation & Food Services in the United States?
Percentage of Population Employed in Accommodation & Food Services in the United States is 6.9%.